| Particulars | FY04 to FY14 | FY14 to FY25 |
|---|---|---|
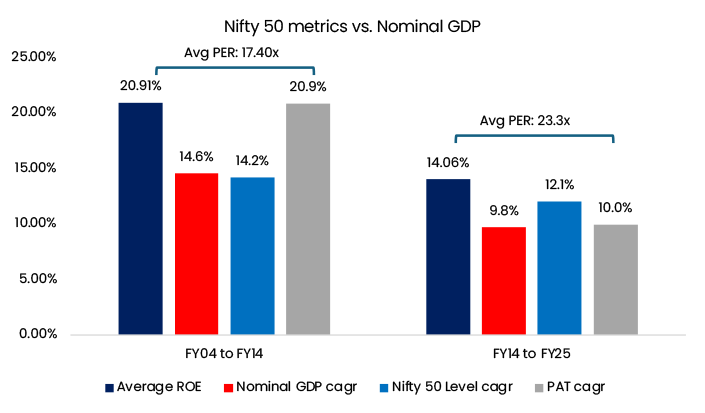
| Average ROE | 20.91% | 14.06% |
| Nominal GDP cagr | 14.6% | 9.8% |
| Nifty 50 Level cagr | 14.2% | 12.1% |
| PAT cagr | 20.9% | 10.0% |
| Average PER | 17.40 | 23.30 |
Cholamandalam Securities Limited Member: BSE, NSE, MSE, NSDL, CDSL
Regd. Office: Chola Crest, C54 – 55 & Super B-4, Thiru-Vi-Ka Industrial Estate, Guindy, Chennai – 600032.
Website: www.cholasecurities.com | Email id – csecsupport@chola.murugappa.com | CIN U65993TN1994PLC028674
Cholamandalam Securities Limited (CSEC) is a SEBI registered stock broker and depository participant. CSEC does not provide investment advisory services. Investors are advised to consult an independent financial advisor before taking any investment decisions.
| RESEARCH | |||
|---|---|---|---|
| Dharmesh Kant | Head of Equity Research | +91-44-40047360 | dharmeshkt@chola.murugappa.com |
| Balaji H | Compliance Officer | 044-30007226 | balajih@chola.murugappa.com |
| Prem Kumar R | Customer Service | 1800 425 4477 | premkumarram@chola.murugappa.com |
This report is for private circulation and for the personal information of the authorized recipient only, and we are not soliciting any action based upon it. This report is not to be construed as an offer to sell or the solicitation of an offer to buy any security in any jurisdiction where such an offer or solicitation would be illegal. It does not provide individually tailor-made investment advice and has been prepared without regard to any specific investment objectives, financial situation, or any particular needs of any of the persons who receive it. The research analyst(s), Cholamandalam Securities Limited (CSL), AMFI registered mutual fund distributor, who is primarily responsible for this report certifies that: (1) all of the views expressed in this report accurately reflect his or her personal opinions about any and all of the subject securities or issuers; and (2) no part of any of the research analyst’s compensation was, is, or will be directly or indirectly related to the specific recommendations or views expressed in this report. This report has been prepared on the basis of information that is already available in publicly accessible media or developed through analysis of Cholamandalam Securities Limited makes every effort to use reliable, comprehensive information, but we make no representation that it is accurate or complete. The views expressed are those of the analyst and the Company may or may not subscribe to all the views expressed therein Cholamandalam Securities Limited reserves the right to make modifications and alterations to this statement as may be required from time to time without any prior approval. Cholamandalam Securities Limited, its affiliates, directors and employees may from time to time, effect or have effect an own account transaction in or deal as agent in or for the securities mentioned in this report. The recipient should take this into account before interpreting the report. All investors may not find the securities discussed in this report to be suitable. Cholamandalam Securities Limited recommends that investors independently evaluate particular investments and strategies. Investors should seek the advice of a financial advisor with regard to the appropriateness of investing in any securities / investment strategies recommended in this report. The appropriateness of a particular investment or strategy will depend on an investor’s individual preference. Past performance is not necessary a guide to future performance. Estimates of future prospects are based on assumptions that may not be realized. Re-publication or redistribution in any form, in whole or in part, is prohibited. No part of this material may be duplicated in any form and/or redistributed without Cholamandalam Securities Limited prior written consent. The news items appearing in this are collected from various media sources and we make no representations that it is complete or accurate.
This report is for private circulation and for the personal information of the authorized recipient only, and we are not soliciting any action based upon it. This report is not to be construed as an offer or solicitation to buy or sell any security.
The research analyst certifies that all views expressed in this report accurately reflect his/her personal views. Cholamandalam Securities Limited makes every effort to ensure reliable information but makes no representation that it is accurate or complete.