
High Conviction • Mid Cap (FY27)
Chola Securities
(FY27)
Date: 10th June, 2026
Stocks
5
Weight Each
20%
Investment Horizon
1 year
Benchmark
Nifty Midcap 150
| Sr No | Stock | Rating | Weightage | CMP * (9-June) |
Market Cap * (Rs. Cr) (9-June) |
Return on Equity (FY26 ROE%) |
Price to Earnings Ratio* (PER) (9-June) |
|---|---|---|---|---|---|---|---|
| 1 | Tata Technologies | BUY | 20% | 745 | 30,251 | 14.60% | 55.19 |
| 2 | Aurionpro Solutions | BUY | 20% | 766 | 4,238 | 13.10% | 19.70 |
| 3 | Bank of India | BUY | 20% | 148 | 67,213 | 14.90% | 6.52 |
| 4 | Dixon Technologies (India) | BUY | 20% | 11,611 | 70,943 | 37.10% | 49.07 |
| 5 | IndusInd Bank Ltd | BUY | 20% | 923 | 71,886 | 3.64% | 80.95 |
*CMP, Mcap & PER are as of closing price on 9th June, 2026
Source: CSEC Research, Company Filings, Company Website, NSE, BSE • Date: 10th June, 2026
The model portfolio consists of 5 mid-cap stocks. Each constituent has been selected based on fundamental analysis, with a documented investment rationale covering business model, financial performance, valuation metrics, and recent developments.
The constituent securities of this model portfolio are selected from the basket of stocks whose market capitalization lies in the range of Rs. 10,000 crores to Rs. 1,50,000 crores.
The selection process is based solely on fundamental research. Key evaluation parameters include an assessment of the company’s business model and product offerings, analysis of historical financial statements, financial and valuation ratios, and recent business developments over the last 4 to 12 quarters.
10th June, 2026
This is an equity-only, mid-cap model portfolio comprising stocks selected exclusively from the Nifty Midcap 150 index.
The model portfolio is rebalanced quarterly, following the conclusion of each earnings season. Rebalancing occurs four times in a financial year, as outlined below:
Q1 (April–June)
Rebalanced by end-August, post earnings season (July to mid-August)
Q2 (July–September)
Rebalanced by end-November, post earnings season (October to mid-November)
Q3 (October–December)
Rebalanced by end-February, post earnings season (January to mid-February)
Q4 (January–March)
Rebalanced by end-May, post earnings season (April to end-May)
Rebalancing dates are aligned with the earnings disclosure timelines of listed companies to reflect the most recent financial and business developments.
The model portfolio consists of 5 stocks; each assigned an equal weight of 20%.
1 year
The model portfolio is updated at predefined quarterly intervals, aligned with the conclusion of each corporate earnings season.
Investments in equity securities are subject to market risks, including price volatility, economic and political uncertainties, interest rate fluctuations, and sector-specific developments. Past performance is not indicative of future results. There is no assurance of returns or capital protection. Investors are advised to consider their risk tolerance and investment objectives before acting on this model portfolio.
The performance of this model portfolio will be benchmarked against the Nifty Midcap 150 index.
Date: 10th June, 2026
Stock 1 of 5
Tata Technologies Ltd., established in 1994, is a leading global engineering research and development (ER&D) services company focused on product engineering and digital transformation for the mobility and manufacturing sectors. A part of the Tata Group, the company provides outsourced engineering services and technology-led solutions to global original equipment manufacturers (OEMs) and Tier-1 suppliers across automotive, aerospace, and industrial machinery domains.
The company operates through a hybrid onshore-offshore delivery model with over 12,500 professionals across 20 global delivery centers, including facilities in North America, Europe, and Asia-Pacific. Offshore hubs in India and Romania enable cost-effective execution, while client-facing teams in the US, UK, Germany, and France ensure high customer proximity and responsiveness. Anchor clients include Tata Motors and Jaguar Land Rover, which together contributed ~50% of FY24 revenue, with the balance from diversified global OEMs such as Airbus, Honda, Ford, and McLaren.
Tata Technologies offers end-to-end ER&D capabilities, including concept design, simulation, validation, manufacturing engineering, embedded systems, and aftersales solutions. The company also provides technology solutions through the resale and implementation of third-party software (PLM, MES, ERP) and operates a digital education platform (iGetIT) that supports skilling and curriculum modernization for government industrial training institutes (ITIs) and enterprises.
Tata Technologies is uniquely positioned as the only Indian ER&D firm capable of delivering full-vehicle development, including both mechanical systems and embedded software integration. Its global competitiveness is further enhanced by proprietary platforms such as eVMP (Electric Vehicle Modular Platform), FactoryMagix, and AMP.IOT, and by strategic partnerships with leading technology firms such as Intel, Arm, AWS, and NXP.
As of FY26, the company continues to expand its footprint in embedded systems and digital engineering, with a fast-scaling joint venture with BMW Group (BMW TechWorks India Pvt. Ltd.) and strategic collaborations in battery development and smart manufacturing. Further, the acquisition of ES-Tec for € 75 million significantly strengthens the company’s capabilities in embedded software, ADAS, connected vehicles technologies. Tata Technologies combines deep industry expertise, scalable delivery, and cost-efficient innovation to support the evolving digital and electrification needs of the global manufacturing sector.
Tata Technologies Ltd. operates as a global engineering research and development (ER&D) services provider with a diversified service portfolio addressing the automotive, aerospace, and industrial machinery sectors. Its business is structured into two primary verticals: Services and Technology Solutions, with the Services segment being the core revenue driver.
This segment encompasses comprehensive ER&D solutions offered across the entire product development lifecycle—from concept design and engineering to validation, manufacturing integration, and post-sales support. The services vertical is delivered through 20 global delivery centers across North America, Europe, and Asia Pacific, with a balanced onshore-offshore model enhancing speed, scalability, and cost competitiveness.
Tata Technologies’ automotive capabilities span mechanical, electrical, and embedded domains, supporting OEMs & Tier-suppliers across:
A growing vertical contributing 3% of revenues in FY24, with expectations of significant scale-up. Offerings include:
Tata Technologies is empaneled as an EMES3 strategic supplier for Airbus, supporting programs in North America and Europe.
The company partners with manufacturers of off-highway and industrial machinery—such as mining equipment, agricultural vehicles, and construction machines—offering services in:
This segment complements core engineering services by offering software product sales and education-based solutions, enhancing client stickiness and value delivery.
Tata Technologies partners with global software providers such as Dassault Systèmes, Siemens, SAP, and PTC to resell and integrate solutions in: Product Lifecycle Management (PLM), Manufacturing Execution Systems (MES), and Enterprise Resource Planning (ERP). The company provides end-to-end implementation, training, and post-deployment support for these platforms.
Through its proprietary iGetIT platform, Tata Technologies delivers technical upskilling programs for both enterprise and academic institutions. The platform offers 2,000+ self-paced modules across: MCAD, PLM, and advanced engineering tools and Next-gen skills in AI, simulation, SDVs, and digital manufacturing. Tata Technologies has formal partnerships with six Indian state governments to modernize 286+ Industrial Training Institutes (ITIs), converting them into Centers of Excellence. These programs focus on bridging the talent gap for Industry 4.0 and smart manufacturing.
| Ratios | FY22 | FY23 | FY24 | FY25 | FY26 |
|---|---|---|---|---|---|
| EPS | 10.77 | 15.38 | 16.75 | 16.69 | 13.47 |
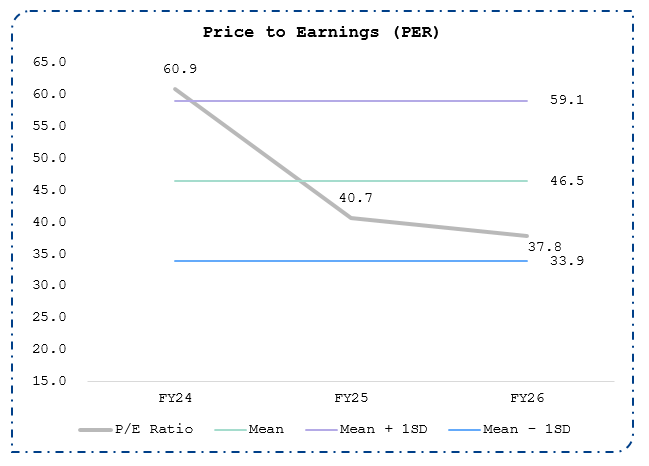
| P/E | - | - | 60.94 | 40.74 | 37.80 |
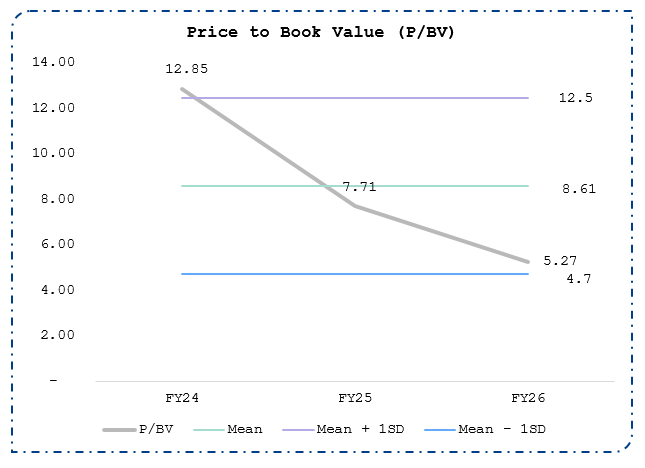
| P/BV | - | - | 12.85 | 7.71 | 5.27 |
| Du Pont Analysis | |||||
| (a) Net Profit / Sales | 0.12 | 0.14 | 0.13 | 0.13 | 0.10 |
| (b) Sales / Total Assets | 0.91 | 0.94 | 0.95 | 0.84 | 0.71 |
| (c) Total Assets / Total Equity | 1.76 | 1.79 | 1.74 | 1.80 | 2.18 |
| Return on Equity | 19.7% | 23.7% | 21.9% | 19.9% | 14.6% |
| Return on Capital Employed | 22.8% | 25.3% | 25.0% | 21.9% | 15.5% |
| Particulars | FY24 | FY25 | FY26 |
|---|---|---|---|
| Revenue from Operations | 5,117 | 5,168 | 5,506 |
| Other Income | 116 | 124 | 175 |
| Total Income | 5,233 | 5,293 | 5,680 |
| Less: Expenses | 4,176 | 4,234 | 4,653 |
| EBITDA | 941 | 934 | 853 |
| EBITDA Margin (%) | 18.4% | 18.1% | 15.5% |
| Less: Depreciation | 106 | 121 | 145 |
| EBIT | 835 | 813 | 708 |
| Less: Finance Cost | 19 | 20 | 34 |
| EBT | 817 | 793 | 674 |
| Share of Profit / (Loss) of Associates and Joint Ventures | - | 4 | 24 |
| Exceptional Item | - | - | -108 |
| PBT | 932 | 921 | 765 |
| Less: Tax | 253 | 244 | 218 |
| PAT | 679 | 677 | 547 |
| EPS | 16.8 | 16.7 | 13.5 |
| Particulars | FY24 | FY25 | FY26 |
|---|---|---|---|
| Equity and Liabilities | |||
| Equity Capital | 81 | 81 | 81 |
| Reserves | 3,140 | 3,498 | 3,842 |
| Borrowings | 286 | 258 | 1,122 |
| Other Liabilities | 2,071 | 2,827 | 3,909 |
| Total Equity and Liabilities | 5,578 | 6,664 | 8,953 |
| Assets | |||
| Fixed Assets | 1,151 | 1,130 | 2,055 |
| CWIP | - | - | 15 |
| Investments | 150 | 616 | 823 |
| Cash and Cash Equivalents | 913 | 903 | 715 |
| Other Assets | 3,364 | 4,016 | 5,345 |
| Total Assets | 5,578 | 6,664 | 8,953 |
Source: CSEC Research, Company Filings, Company Website, NSE, BSE • Date: 10th June, 2026
Stock 2 of 5

Incorporated in 1997 and headquartered in Mumbai, Aurionpro Solutions Limited (“Aurionpro” / “the company”) has evolved into a diversified global enterprise-technology organisation that operates at the intersection of financial-services software, smart-mobility systems, and digital-infrastructure engineering. Listed on both the NSE and BSE, the company today employs over 3,100 professionals across its delivery hubs in Mumbai, Pune, Singapore, Kuala Lumpur, Dubai, and Istanbul, serving more than 350 enterprise clients in over 30 countries. Over the past five years, Aurionpro has delivered a steep growth trajectory, with consolidated revenue from operations expanding from Rs. 374 crore in FY21 to Rs. 1,173 crore in FY25. The company has reported 30%+ YoY growth consistently during the period. As of end-FY26, the company reported an order book of ~Rs. 1,800 crore while maintaining an EBITDA margin of ~20%, reflecting the structural operating leverage of its IP-led model despite revenue growth moderating to 20% in FY26.
Aurionpro’s business structure is anchored in two synergistic divisions — the Banking & Fintech segment, which accounted for roughly 53% of FY26 revenues, and the Technology Innovation Group (TIG), contributing the remaining 47%. Together these segments position Aurionpro as a unique hybrid of software-IP monetisation and infrastructure-technology execution, bridging the enterprise and public-sector digital-transformation spectrum.
The Banking & Fintech division represents the company’s intellectual-property core and delivers mission-critical platforms to global banks and financial institutions across transaction banking, lending, treasury, digital-engagement, and payments-aggregation domains. Its flagship solutions include iCashPro, a comprehensive cash- and liquidity-management platform that covers corporate internet banking, payables, receivables, trade finance, and virtual-account management, and is deployed at major institutions such as State Bank of India (SBI), UOB, OCBC, and Bank of Ayudhya (BAY). The SmartLender / Integro Suite provides end-to-end automation of the credit-lifecycle process across corporate, retail, and SME lending, integrating modules for origination, risk assessment, documentation, disbursement, and monitoring; this suite is strengthened through the integration of Arya.ai’s Explainable-AI (XAI) engine for model transparency and regulatory auditability. The Fenixys treasury and capital-markets suite offers mid-tier banks integrated risk, trading, and regulatory-reporting tools, while AuroDigi powers omnichannel digital-banking interfaces across web, mobile, and kiosk channels. Complementing these is Auropay and Auropay Biz, Aurionpro’s payment- and aggregation-gateway ecosystem that enables digital collections, payouts, and reconciliation for banks, fintechs, and enterprises. The Banking & Fintech segment’s revenue base is predominantly annuity-driven, supported by multi-year term licences, renewals, and mandatory upgrades that underpin recurring cash flows.
Parallelly, the Technology Innovation Group (TIG) extends Aurionpro’s domain expertise into infrastructure-grade digital systems, comprising three verticals — Transit & Smart Mobility, Data Centre & Hybrid Cloud, and Government & Smart City. In Transit & Smart Mobility, Aurionpro provides a fully integrated open-loop fare-collection and mobility-management suite, incorporating automated gates, Validators, and ticket vending. These platforms handle contactless payments (EMV Contact / Contactless / NCMC / QR), multi-operator clearing, mobile ticketing, and fleet-management analytics. Projects executed include the Delhi, Chennai, and Mumbai Metro networks in India, as well as Cairo Metro (Egypt), the Maldives Integrated Transport Network, and vendor empanelment in the California open-loop programme in the U.S. Manufacturing of gates, validators, and AFC hardware is carried out through subsidiary Aurionpro Toshi Automatic Systems Ltd, with production bases in India and Malaysia, while dedicated R&D hubs in Istanbul, Singapore, and London drive certification and product innovation.
Aurionpro’s Banking & Fintech division contributes ~54% of consolidated FY26 revenue and comprises an integrated suite of enterprise platforms spanning Transaction Banking, Lending Platforms, Treasury & Capital Markets, Digital Engagement, and Payments & Aggregation. The portfolio is built around proprietary IP and modular, API-first architectures that integrate with incumbent cores, & is deployed across Tier-1 PSU banks in India, leading Southeast Asian institutions, and selected customers in the Middle East & Africa.
Aurionpro’s iCashpro is the flagship transaction-banking suite powering cash- and liquidity-management across multi-entity, multi-currency, multi-geography footprints. The platform covers the full corporate-banking stack, including Corporate Internet Banking, Liquidity Management, Receivables Management, Payables Management, Financial Supply Chain, Collections, Trade Finance, Payments, and Forex Services. It is designed for open-API/host-to-host and SWIFT connectivity, with elastic scalability (benchmarked at ~5 million transactions per hour, 24×7 availability and high concurrency) to support very large banks and real-time corporate flows. Within the cash & trade layer, Aurionpro also offers Fintra, a trade-finance platform purpose-built to digitise end-to-end trade workflows and eliminate legacy process frictions through configurable rules, document handling, and integrated compliance.
Aurionpro is strengthening its IP-led fintech strategy through Orion MSP, an LLM designed specifically for structured enterprise data, and AurionAI, designed for banking-specific AI use cases. Crucially, these solutions are being embedded into its existing platforms, enhancing functionalities across lending, risk, and transaction banking.
The suite serves as the transaction backbone for major clients, led by State Bank of India (SBI)—a Rs. 100+ Cr enterprise deployment following a BCG-run global evaluation—and regional banks such as UOB, OCBC, and Bank of Ayudhya (BAY). iCashpro’s module library (e.g., virtual accounts, pooling, real-time reconciliation, host-to-host AR/AP automation) enables progressive roll-outs and wallet expansion across corporate and SME segments. Demand is driven by corporate-banking digitisation, mandatory liquidity and reporting standards, and migration to virtual-account architectures across India, ASEAN, and the Middle East.
The SmartLender / Integro Lending Suite spans the complete lending lifecycle—loan origination, credit assessment, documentation, disbursement, servicing, monitoring, collections, and GL/Fixed Asset integration—with pre-configured suites by segment. The Corporate Lending Suite enumerates modules such as Loan Origination System, Financial Analytics, Risk Analytics, ESG, Digital Form/Smart Capture, Data Connect/Intelligence, and credit-rules orchestration. The Retail Lending Suite lists Customer Onboarding, Credit Processing, Loan Servicing, Debt Management, Admin, GL & Fixed Assets, and omnichannel interfaces. Product coverage cuts across retail (asset finance, mortgages, LAP, personal loans, consumer-durable loans, gold loans, credit cards), SME (asset finance, working capital, supply-chain finance), commercial (term loan, working capital, project finance, real-estate lending, agri credit, commercial mortgage-backed), and large corporate/financial institutions (syndicated and leveraged loans, bill discounting, letters of credit, private credit, Islamic finance).
The portfolio is reinforced by Infrarisk (recently acquired; Melbourne-based software for lending) and is integrated with Arya.ai/AryaXAI capabilities for explainable-AI scoring, model monitoring, and audit.
FY25 deployments and upgrades were executed across UOB, OCBC, BAY and Indian NBFCs/small-finance banks, with localisation for RBI/MAS/IFRS9/Basel requirements and open-API ecosystems. The suite is architected to shorten implementation timelines via domain templates and to scale across geographies through partner-led delivery in the Middle East and Europe.
Aurionpro’s capital-markets stack combines proprietary and partner-led offerings. The firm provides Murex Managed Services and Murex Advisory Solutions that deliver full lifecycle support—implementation, upgrades, release management, regression testing, bespoke configuration, and risk/treasury transformation advisory—targeting banks seeking predictable operations and accelerated roadmap velocity. Aurionpro also references Fenixsys, described as a next-gen core technology platform for modern capital markets in the materials, complementing the advisory/managed layer with product-adjacent engineering depth. On the treasury front, FXConnect bridges FX Treasury with core banking, with distinct Retail Services (real-time FX rates, notes/DD/TT/TC issuance, re-issuance and transfers) and Corporate Services (FCY cash-management, cross-border funds transfer, enterprise FX workflows).
This vertical is delivered primarily in Southeast Asia and India, often as a cross-sell into SmartLender or iCashpro clients in need of integrated front-to-back treasury and regulatory reporting. Enhancements noted in FY25 include expanded market-data interfaces and algorithmic pricing modules for real-time exposure tracking and valuation.
The Digital Banking Engagement layer is centred on AuroDigi, a one-stop platform for unified digital experiences spanning web, mobile, kiosk, and chatbot interfaces. It is positioned for multi-entity, multi-currency banks, supports advanced analytics, and is cloud-native with open-banking support, enabling rapid channel rollout without core replacement. Aurionpro’s Interactive Communications suite expands front-end capabilities through:
Channel-adjacent products enhance in-branch and self-service CX, including OptiQ (queue-management system), Insight (customer-feedback/voice-of-customer platform), self-service kiosks tailored for banking/telecom/airport/healthcare/government use-cases, and Experia (digital signage and menu-board orchestration with centralised screen layout and content control). FY25 deployments include PSU/co-operative bank front-end modernisation and selected private-bank channel upgrades, with rising attach to the core iCashpro/SmartLender estates.
Aurionpro’s payments-infrastructure layer centres on Auropay and Auropay Biz. Auropay is a technology-driven platform for secure payment acceptance and orchestration with modules for payouts/collections, settlement & reconciliation, dashboards, reporting, notifications, and fraud & risk management. Auropay Biz is a cloud-based accounts-payable platform that streamlines invoice-to-pay workflows, supports automatic reconciliation, and features automatic sync with accounting systems for auditability. The portfolio also reference Business Payments – Auropaybiz for future-proofing AP processes and creating efficiency across the enterprise payables lifecycle.
The payments layer is implemented for banks, enterprises, and public-sector undertakings, including use-cases where payment gateways interoperate with transit/toll systems and smart-city infrastructure. Partnerships with global card networks and processors extend multi-rail coverage, while API-first integration allows payments modules to be embedded alongside iCashpro and Digital Engagement components in bank and enterprise estates.
Aurionpro’s Technology Innovation Group (TIG) accounted for ~47% of FY26 revenue, reflecting the company’s parallel expansion beyond financial software into infrastructure-technology, mobility, and data-centre solutions. TIG integrates proprietary hardware, middleware, and engineering services through three focused business lines - Transit & Smart Mobility, Data Centre & Hybrid Cloud, and Government & Smart City — supported by manufacturing and R&D bases in Malaysia, India, Istanbul, Singapore, and London.
The Transit & Smart Mobility vertical is the largest contributor within TIG, forming roughly 40% of TIG revenues in FY25 (~19% of overall FY25 revenue). It delivers an end-to-end open-loop, EMV-certified fare-collection and transit-automation stack that combines proprietary hardware, embedded software, clearing systems, and mobility analytics.
The product suite includes:
Aurionpro’s transit platforms are deployed in Delhi Metro, Chennai Metro, and Mumbai Metro and have been rolled out internationally for Egypt’s Cairo Metro, Maldives Integrated Transport Network, and vendor-empanelment in the California open-loop programme (U.S.). Hardware manufacturing and integration are executed through Aurionpro Toshi Automatic Systems Ltd, the company’s Indian manufacturing arm specialising in gates, validators, and automatic-fare-collection components. R&D hubs in Istanbul, Singapore, and London focus on certification and protocol interoperability, while factories in Malaysia and India manage supply-chain control.
This vertical benefits from strong structural demand for open-loop mobility ecosystems, driven by government directives for interoperable transit payments, rapid urbanisation, and public-transport digitalisation. FY25 saw multiple new wins in Asia and the Middle East alongside renewals for metro expansions in India.
The Data Centre & Hybrid Cloud vertical operates on an asset-light engineering and programme-management model. Aurionpro provides turnkey services covering consulting, design, construction supervision, testing & commissioning, and programme management for Tier III and Tier IV data-centre facilities. Its portfolio also includes data-centre automation frameworks, energy-efficiency optimisation, and AI-driven monitoring and control systems.
Flagship engagements include programme management for the Reserve Bank of India’s Tier IV data centre, multi-megawatt facilities for Iron Mountain India, and various projects for state and private-sector clients across India and the Middle East. Aurionpro’s IP layer integrates design templates, predictive-maintenance algorithms, and digital-twin visualisation to enhance project efficiency. The vertical leverages partnerships with global data-centre operators and colocation providers, focusing on sustainability, uptime certification, and cybersecurity compliance.
The global trend toward hybrid-cloud adoption, regulatory localisation of financial data, and the rising need for energy-efficient hyperscale builds underpin the division’s sustained visibility.
The Government & Smart City vertical delivers integrated command-and-control and urban-automation systems that unify surveillance, traffic, energy, and citizen-service layers on a single digital platform. Aurionpro’s proprietary Command & Control Suite integrates modules for video analytics, incident response, intelligent lighting, environmental monitoring, and transport coordination. Complementary solutions include integrated access and perimeter-security management and smart-meter and energy-analytics platform.
The company has implemented state-level command-centres and urban-governance projects under India’s Smart Cities Mission and extended modules to markets in Southeast Asia and the Middle East. Government & Smart City leverages cross-domain IP from Transit & Payments to deliver interoperable public-service infrastructures—for example, integrated payment modules for parking and toll systems, or shared analytics dashboards linking citizen-service applications with transport-command centres. The business plays a strategic role in establishing public-sector credibility and generating references for larger urban-digitisation mandates.
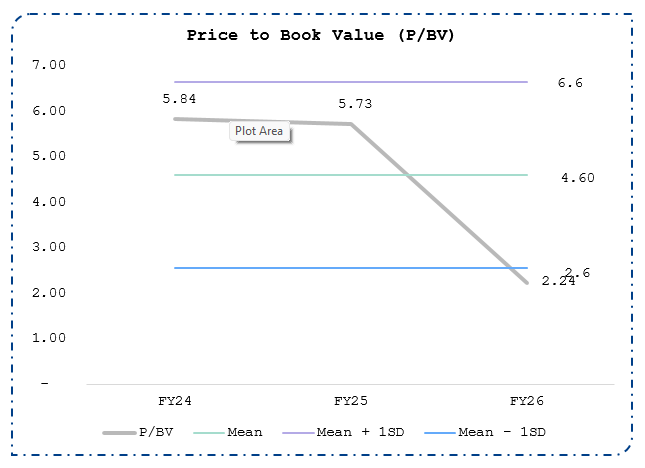
| Ratios | FY22 | FY23 | FY24 | FY25 | FY26 |
|---|---|---|---|---|---|
| EPS | 15.50 | 21.35 | 28.11 | 34.72 | 38.90 |
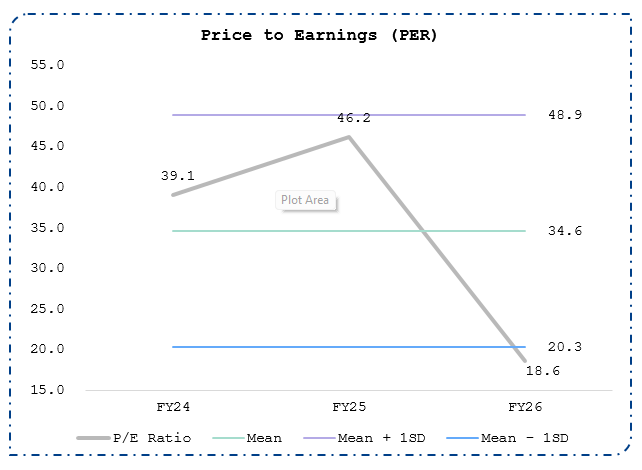
| P/E | 11.01 | 7.22 | 39.07 | 46.20 | 18.63 |
| P/BV | 1.96 | 1.41 | 5.84 | 5.73 | 2.24 |
| Du Pont Analysis | |||||
| (a) Net Profit / Sales | 0.15 | 0.15 | 0.16 | 0.16 | 0.15 |
| (b) Sales / Total Assets | 0.80 | 0.88 | 0.79 | 0.70 | 0.66 |
| (c) Total Assets / Total Equity | 1.72 | 1.67 | 1.57 | 1.38 | 1.32 |
| Return on Equity | 20.6% | 22.8% | 20.0% | 15.5% | 13.1% |
| Return on Capital Employed | 22.7% | 25.5% | 22.2% | 16.5% | 14.4% |
| Particulars | FY24 | FY25 | FY26 |
|---|---|---|---|
| Revenue from operations | 887 | 1,173 | 1,411 |
| Other income | 9 | 20 | 29 |
| Total Income | 897 | 1,193 | 1,440 |
| Less: Expenses | 694 | 931 | 1,129 |
| EBITDA | 193 | 242 | 282 |
| EBITDA Margin | 21.8% | 20.6% | 20.0% |
| Less: D&A | 21 | 30 | 39 |
| EBIT | 173 | 212 | 243 |
| Less: Finance Cost | 13 | 7 | 10 |
| Profit Before Tax and Exceptional items | 160 | 205 | 233 |
| Less: Exceptional items | - | - | -10 |
| Profit Before Tax | 169 | 225 | 252 |
| Less: Tax Expense | 26 | 37 | 41 |
| Tax Rate | 15% | 16% | 16% |
| PAT | 143 | 188 | 212 |
| PAT Margin | 16% | 16% | 15% |
| Earnings Per Share (EPS) | 28.1 | 34.7 | 38.9 |
| Particulars | FY24 | FY25 | FY26 |
|---|---|---|---|
| EQUITY AND LIABILITIES | |||
| Share Capital | 25 | 54 | 54 |
| Reserves | 905 | 1,450 | 1,684 |
| Non Controlling Interest | 16 | 5 | 7 |
| Borrowings | 214 | 153 | 293 |
| Other Liabilities | 238 | 289 | 297 |
| TOTAL EQUITY & LIABILITUES | 1,398 | 1,950 | 2,335 |
| ASSETS | |||
| Fixed Assets | 449 | 732 | 824 |
| Capital Work – in – progress | 23 | 20 | 67 |
| Investments | 0 | - | - |
| Cash & Cash Equivalents | 269 | 362 | 205 |
| Other Assets | 657 | 836 | 1,238 |
| TOTAL ASSETS | 1,398 | 1,950 | 2,335 |
Source: CSEC Research, Company Filings, Company Website, NSE, BSE • Date: 10th June, 2026
Stock 3 of 5
Bank of India is an Indian public sector bank headquartered in Mumbai, founded in 1906. It was under private ownership and control until 1969, post which was nationalised along with 13 other banks. The bank provides various banking products and services in India and internationally. Presently it has an overseas presence in 15 foreign countries, spread over 5 continents at key banking and financial centres viz., Tokyo, Singapore, Hong Kong, London, Paris, New York, DIFC Dubai and International Banking Unit (IBU) at GIFT City Gandhinagar. It operates through Treasury, Wholesale Banking, and Retail Banking segments.
Further, it also provides NRI services, including loans, money remittance and ancillary services, as well as agri products such as Kisan credit card, gold loan, self-help group, Atmanirbhar schemes, tractor/farm mechanization and food & agri loans.
The Bank has an extensive network of 5,511 branches and 7,685 ATMs & CRA in India spread over all states/union territories including specialized branches. Around 36% of branches are located in Rural area and 19% are in metro cities. The Bank has 22 Overseas Branches, 1 Representative Office at Jakarta, 4 Subsidiaries, 1 Associate/Joint Venture, all spread across 15 countries in 5 Continents of all time zones.
The contribution of foreign operations in Bank’s global business mix has been 13% for FY26.
‘Treasury’ segment includes the entire investment portfolio i.e. dealing in Government and other Securities, Money Market Operations and Forex Operations including Derivative contracts.
Wholesale Banking includes all lending activities which are not included under
Retail Banking segment comprises of Digital Banking and Other Retail Banking (Other Retail Banking includes all housing loan accounts and borrower accounts having exposure up to Rs 7.50 crore).
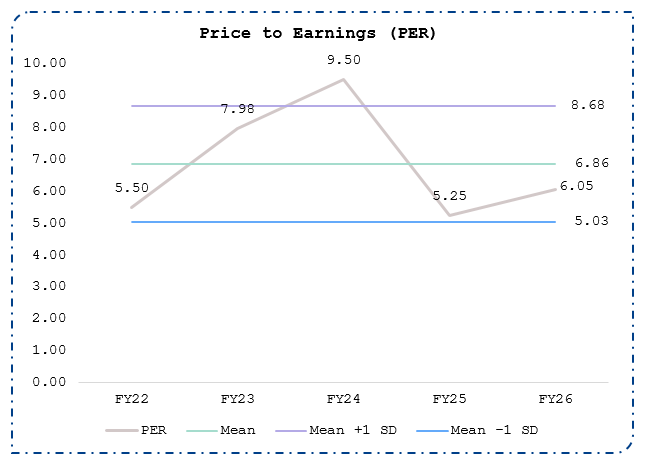
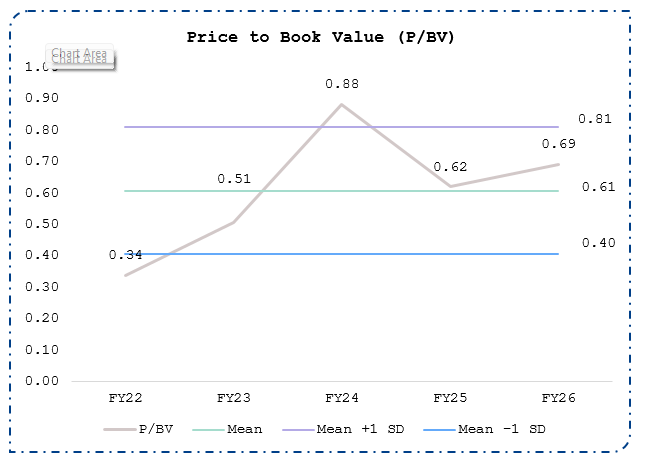
| Particulars | FY22 | FY23 | FY24 | FY25 | FY26 |
|---|---|---|---|---|---|
| EPS | 8.51 | 9.35 | 14.42 | 20.97 | 22.64 |
| EPS Growth | 9.9% | 54.2% | 45.4% | 8.0% | |
| PER | 5.50 | 7.98 | 9.50 | 5.25 | 6.05 |
| P/BV | 0.34 | 0.51 | 0.88 | 0.62 | 0.69 |
| GNPA | 9.98% | 7.31% | 4.98% | 3.27% | 1.98% |
| NNPA | 2.34% | 1.66% | 1.22% | 0.82% | 0.56% |
| PCR | 87.76% | 89.68% | 90.59% | 92.39% | 93.57% |
| ROA | 0.43% | 0.49% | 0.70% | 0.90% | 0.93% |
| ROE | 10.55% | 10.31% | 13.13% | 15.27% | 14.90% |
| NIM | 2.36% | 3.01% | 2.97% | 2.82% | 2.52% |
| Particulars | FY24 | FY25 | FY26 |
|---|---|---|---|
| Interest earned | 61,073 | 71,308 | 75,613 |
| a. Interest / discount on advances / bills | 43,126 | 50,337 | 53,793 |
| b. Income from investment | 14,246 | 17,384 | 18,193 |
| c. Interest on balances with RBI & others | 2,886 | 3,206 | 2,766 |
| d. Others | 815 | 381 | 862 |
| Other Income | 6,233 | 9,105 | 10,036 |
| Total Income | 67,306 | 80,412 | 85,650 |
| Interest expended | 37,757 | 46,594 | 50,139 |
| Operating Expenses | 15,306 | 17,210 | 18,251 |
| Employees Cost | 9,263 | 10,387 | 10,450 |
| Other Operating Expenses | 6,044 | 6,823 | 7,801 |
| Total Expenditure | 53,063 | 63,804 | 68,390 |
| Operating | 14,243 | 16,608 | 17,260 |
| Provision (other than tax) & Contingencies | 4,050 | 4,050 | 3,188 |
| Exceptional Items | - | - | 519 |
| Profit from Ordinary Activities before tax | 10,193 | 12,558 | 13,553 |
| Tax Expenses | 3,809 | 3,219 | 3,463 |
| Net Profit for the Period | 6,385 | 9,339 | 10,089 |
| EPS (Earnings Per Share) | 14.42 | 20.97 | 22.64 |
| Particulars | FY24 | FY25 | FY26 |
|---|---|---|---|
| Capital & Liabilities | |||
| Capital | 4,553 | 4,553 | 4,553 |
| Reserves & Surplus | 66,028 | 76,172 | 85,405 |
| Minority Interest | 161 | 162 | 178 |
| Deposits | 7,40,611 | 8,19,806 | 9,30,973 |
| Borrowing | 80,960 | 1,23,869 | 1,18,626 |
| Other Liabilities & Provision | 31,967 | 31,862 | 39,815 |
| Total Capital & Liabilities | 9,24,280 | 10,56,425 | 11,79,552 |
| Assets | |||
| Cash and Balances with Reserve Bank of India | 38,894 | 52,126 | 47,660 |
| Balances with Banks and Money at Call and Short Notice | 44,229 | 48,711 | 51,929 |
| Investments | 2,34,592 | 2,68,002 | 2,79,084 |
| Advances | 5,66,644 | 6,53,518 | 7,64,651 |
| Fixed Assets | 10,328 | 12,047 | 11,877 |
| Other Assets | 29,594 | 22,020 | 24,350 |
| Total Assets | 9,24,280 | 10,56,425 | 11,79,552 |
Source: CSEC Research, Company Filings, Company Website, NSE, BSE • Date: 10th June, 2026
Stock 4 of 5

Dixon Technologies (India) Limited, founded in 1993 and headquartered in Noida, is India’s #1 ranked electronics manufacturing services (EMS) company and holds the #13 position globally. With a robust infrastructure of 30 state-of-the-art manufacturing facilities and 6 dedicated R&D centres, Dixon has emerged as a true powerhouse in consumer electronics and telecommunications.
The company’s diverse portfolio spans mobile phones, telecom and networking products, display solutions, washing machines, refrigerators, hearables, lighting solutions, and computing devices. Serving over 100 global and domestic brands, Dixon acts as the backbone of the electronics ecosystem, providing end-to-end services from design and prototyping to manufacturing, assembly, repair, refurbishment, and quality assurance.
Backed by a dynamic workforce of more than 35,000 employees, Dixon acts as the backbone of the electronics ecosystem. Its commitment to technological excellence, sustainable practices, and customer-centric solutions has positioned it as a trusted partner in powering the future of electronics.
With a strong export footprint and integrated capabilities, the company continues to play a pivotal role in advancing India’s vision of becoming a global hub for electronics manufacturing. Dixon has also been recognized for its contribution to the “Make in India” initiative, strengthening India’s position in global supply chains. Its focus on sustainability, energy-efficient products, and environmentally responsible practices further enhances its reputation as a forward-looking organization
The company offers a comprehensive range of products across multiple segments, making it one of the most diversified players in the electronics manufacturing services industry.
Its consumer electronics portfolio includes LED and smart televisions, interactive flat panels, monitors, and digital signages, catering to both household and commercial applications.
In the home appliances segment, Dixon manufactures semi-automatic and fully automatic washing machines and has also entered refrigerators, designed to meet the evolving needs of modern households. The company is a major producer of mobile devices, including 4G and 5G smartphones and feature phones, serving leading global and domestic brands. Foldable phones remain a niche but emerging category.
The company has expanded into computing devices such as laptops, desktops, and notebooks, as well as wireless wearables and hearables, which are increasingly in demand in the digital lifestyle space.
In this domain, Dixon provides advanced solutions like optical network terminals, 5G fixed wireless access devices, and IPTV set-top boxes, strengthening connectivity infrastructure.
The company also has a strong presence in lighting solutions, offering a wide range of products from LED lamps, battens, bulbs, panels, and smart lights to professional-grade streetlights, floodlights, and industrial lighting systems, serving both domestic and international markets.
Beyond its extensive product portfolio, Dixon Technologies delivers a wide array of services that add significant value to its clients.
Innovation Hub: Through its Innovation Hub, the company drives digital transformation, advanced research and development, precision manufacturing, and design and prototyping, ensuring that products meet global standards and customer expectations.
Dixon also provides reverse logistics services, including repair and refurbishment of LED TV panels and mobile phones, which enhance product lifecycle management and sustainability. Its quality assurance and performance testing capabilities ensure that every product adheres to stringent international benchmarks.
By integrating manufacturing, assembly, R&D, repair, and quality services, Dixon positions itself not just as a manufacturer but as a complete solutions provider, enabling global brands to scale efficiently and sustainably.
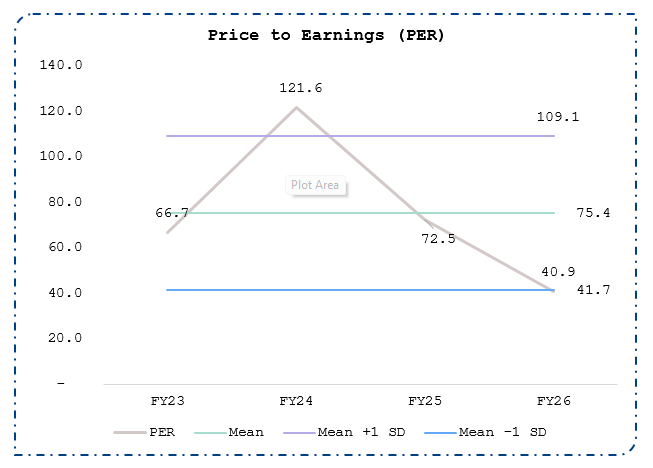
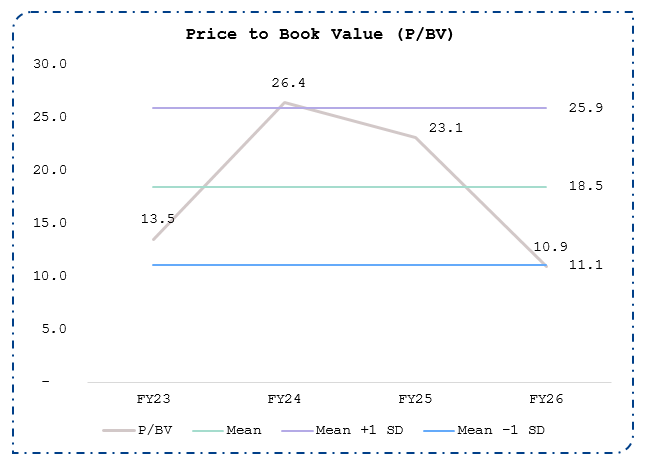
| Ratios | FY24 | FY25 | FY26 |
|---|---|---|---|
| EPS | 61.50 | 181.87 | 236.60 |
| P/E | 121.61 | 72.47 | 40.88 |
| P/BV | 26.40 | 23.10 | 12.58 |
| Du Pont Analysis | |||
| (a) Net Profit / Sales | 0.02 | 0.03 | 0.03 |
| (b) Sales / Total Assets | 3.03 | 3.27 | 2.72 |
| (c) Total Assets / Total Equity | 3.88 | 4.58 | 4.06 |
| Return on Equity | 24.9% | 47.5% | 37.1% |
| Particulars | FY24 | FY25 | FY26 |
|---|---|---|---|
| Revenue from Operations | 17,691 | 38,860 | 48,873 |
| Other Income | 23 | 20 | 713 |
| Total Income | 17,713 | 38,880 | 49,586 |
| Less: Expenses | 16,993 | 37,353 | 47,006 |
| EBITDA | 698 | 1,507 | 1,867 |
| EBITDA Margin (%) | 3.9% | 3.9% | 3.8% |
| Less: Depreciation | 162 | 281 | 393 |
| EBIT | 536 | 1,226 | 1,474 |
| Less: Finance Cost | 75 | 154 | 138 |
| EBT | 461 | 1,072 | 1,336 |
| Exceptional Item (Net of Tax) | - | 460 | - |
| PBT | 494 | 1,570 | 2,071 |
| Less: Tax | 119 | 337 | 426 |
| PAT | 375 | 1,232 | 1,644 |
| EPS | 61.5 | 181.9 | 236.6 |
| Particulars | FY24 | FY25 | FY26 |
|---|---|---|---|
| Equity and Liabilities | |||
| Equity Capital | 12 | 12 | 12 |
| Other Equity & Reserves | 1,710 | 3,457 | 5,375 |
| Non-Current Liabilities | 489 | 671 | 994 |
| Other Liabilities | 4,780 | 12,627 | 12,781 |
| Total Equity and Liabilities | 6,991 | 16,767 | 19,162 |
| Assets | |||
| Fixed Assets | 1,996 | 2,774 | 4,172 |
| CWIP | 68 | 257 | 571 |
| Investments | 20 | 536 | 1,007 |
| Cash and Cash Equivalents | 209 | 264 | 941 |
| Other Assets | 4,698 | 12,937 | 12,471 |
| Total Assets | 6,991 | 16,767 | 19,162 |
Source: CSEC Research, Company Filings, Company Website, NSE, BSE • Date: 10th June, 2026
Stock 5 of 5

IndusInd Bank Limited is a leading private sector bank in India, offering a comprehensive suite of banking products and financial services to individuals, corporates, government entities, and public sector undertakings. Incorporated in 1994 and headquartered in Mumbai, the bank operates across four key segments - Treasury, Corporate/Wholesale Banking, Retail Banking, and Other Banking Operations.
The bank provides a wide range of deposit products, including savings, current, and term deposits, along with a diversified lending franchise spanning retail loans (such as vehicle, home, personal, and gold loans), SME and MSME financing, and corporate lending solutions, including working capital and trade finance. It also offers credit, debit, and prepaid cards, alongside wealth management products such as mutual funds and insurance.
IndusInd Bank has established a strong presence in transaction banking, offering services such as cash management, supply chain finance, and trade finance, along with merchant solutions including POS terminals, payment gateways, and digital payment infrastructure. Its treasury and markets division provides foreign exchange services, derivatives, debt capital market solutions, and advisory services to clients. The bank has also made significant investments in digital capabilities, offering robust online banking platforms, remittance solutions, and digital-first financial services aimed at enhancing customer experience and expanding its reach.
The bank offers a comprehensive range of retail banking services, including savings and current accounts, term deposit products, and retail lending solutions such as home loans, vehicle loans, personal loans, gold loans, and loans against property, along with cards and wealth management offerings, including insurance and mutual funds.
The bank provides a wide array of corporate banking solutions, including working capital finance, term loans, trade and export financing, cash management services, and investment banking capabilities such as debt syndication, fund-raising advisory, and mergers and acquisitions advisory.
The bank caters to the financing needs of small and medium enterprises by offering business loans, working capital solutions, and equipment financing tailored to support business growth.
The bank’s treasury and markets division provides foreign exchange services, derivatives trading, debt capital market solutions, and advisory services aimed at managing financial risks and optimizing returns for clients.
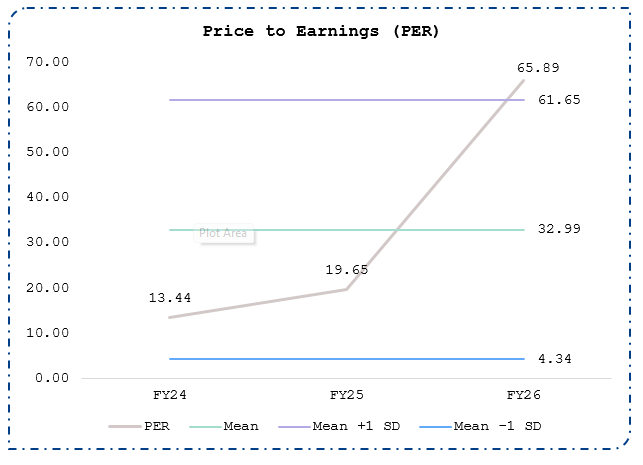
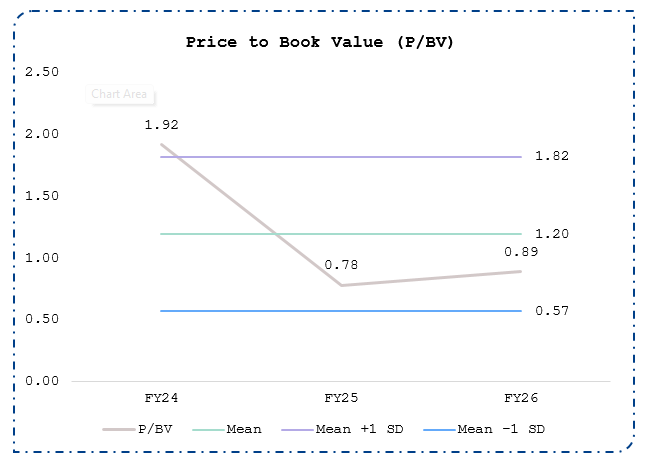
| Particulars | FY24 | FY25 | FY26 |
|---|---|---|---|
| EPS | 115.54 | 33.07 | 11.42 |
| EPS Growth | 45.4% | -65.5% | |
| PER | 13.44 | 19.65 | 65.89 |
| P/BV | 1.92 | 0.78 | 0.89 |
| GNPA | 1.92% | 3.13% | 3.43% |
| NNPA | 0.57% | 0.95% | 1.00% |
| PCR | 71.00% | 70.00% | 71.00% |
| ROA | 1.90% | -1.74% | 0.50% |
| ROE | 15.23% | -14.12% | 3.64% |
| NIM | 4.36% | 2.25% | 3.39% |
| Particulars | FY24 | FY25 | FY26 |
|---|---|---|---|
| Interest earned | 45,748 | 48,668 | 46,251 |
| a. Interest / discount on advances / bills | 38,119 | 39,591 | 36,380 |
| b. Income from investment | 6,202 | 7,663 | 7,910 |
| c. Interest on balances with RBI & others | 1,157 | 1,207 | 1,365 |
| d. Others | 270 | 207 | 595 |
| Other Income | 9,396 | 7,690 | 7,229 |
| Total Income | 55,144 | 56,358 | 53,480 |
| Interest expended | 25,132 | 29,636 | 28,268 |
| Operating Expenses | 14,148 | 16,060 | 16,032 |
| Employees Cost | 5,374 | 6,633 | 7,091 |
| Other Operating Expenses | 8,774 | 9,427 | 8,941 |
| Total Expenditure | 39,280 | 45,697 | 44,300 |
| Operating | 15,864 | 10,661 | 9,180 |
| Provision (other than tax) & Contingencies | 3,885 | 7,136 | 7,969 |
| Exceptional Items | |||
| Profit from Ordinary Activities before tax | 11,979 | 3,526 | 1,210 |
| Tax Expenses | 3,002 | 950 | 321 |
| Net Profit for the Period | 8,977 | 2,575 | 889 |
| EPS (Earnings Per Share) | 115.54 | 33.07 | 11.42 |
| Particulars | FY24 | FY25 | FY26 |
|---|---|---|---|
| Capital & Liabilities | |||
| Capital | 778 | 779 | 779 |
| Reserves & Surplus | 104 | 143 | 151 |
| Minority Interest | 62,326 | 63,914 | 64,809 |
| Deposits | 3,84,586 | 4,10,862 | 3,99,931 |
| Borrowing | 47,611 | 53,704 | 42,789 |
| Other Liabilities & Provision | 19,689 | 24,706 | 34,934 |
| Total Capital & Liabilities | 5,15,094 | 5,54,107 | 5,43,394 |
| Assets | |||
| Cash and Balances with Reserve Bank of India | 18,561 | 51,006 | 29,946 |
| Balances with Banks and Money at Call and Short Notice | 18,347 | 8,369 | 18,987 |
| Investments | 1,06,486 | 1,14,457 | 1,25,007 |
| Advances | 3,43,298 | 3,45,019 | 3,15,871 |
| Fixed Assets | 2,324 | 2,496 | 2,546 |
| Other Assets | 26,078 | 32,760 | 51,037 |
| Total Assets | 5,15,094 | 5,54,107 | 5,43,394 |
Source: CSEC Research, Company Filings, Company Website, NSE, BSE • Date: 10th June, 2026