High Conviction Basket • Large Cap (FY27)
Chola Securities
(FY27)
Date: 4th June, 2026
Stocks
5
Weight Each
20%
Investment Horizon
1 year
Benchmark
Nifty 100
| Sr No | Stock | Rating | Weightage | CMP * (3-June) |
Market Cap * (Rs. Cr) (3-June) |
Return on Equity (FY26 ROE%) |
Price to Earnings Ratio * (PER) (3-June) |
|---|---|---|---|---|---|---|---|
| 1 | Reliance Industries Ltd | BUY | 20% | 1,313 | 17,76,557 | 9.10% | 21.99 |
| 2 | Axis bank | BUY | 20% | 1,255 | 3,90,367 | 14.74% | 14.78 |
| 3 | Hindustan Aeronautics Ltd | BUY | 20% | 4,263 | 2,85,165 | 24.00% | 31.34 |
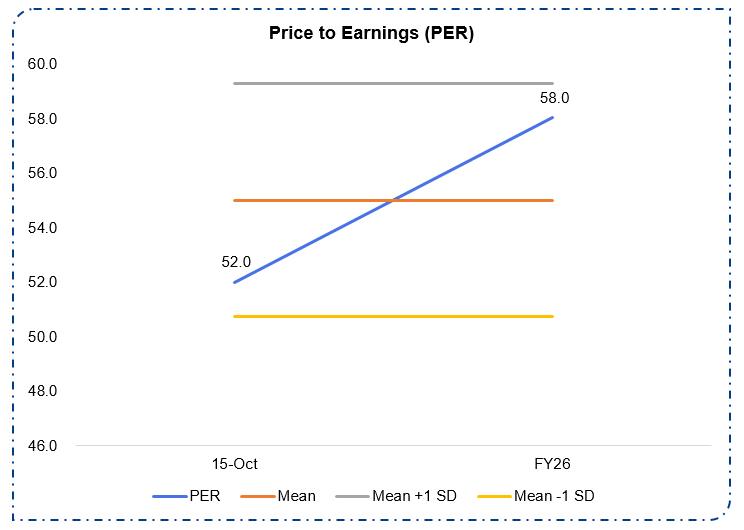
| 4 | LG Electronics India Ltd | BUY | 20% | 1,519 | 1,03,113 | 24.70% | 61.23 |
| 5 | Mazagon Dock Shipbuilders Ltd | BUY | 20% | 2,442 | 98,394 | 29.10% | 38.15 |
*CMP, Mcap & PER are as of closing price on 3rd June, 2026
Date: 4th June, 2026
The model portfolio consists of 5 large-cap stocks. Each constituent has been selected based on fundamental analysis, with a documented investment rationale covering business model, financial performance, valuation metrics, and recent developments.
The constituent securities of this model portfolio are selected from the Nifty 50 and Nifty Next 50 indices, comprising large-cap stocks.
The selection process is based solely on fundamental research. Key evaluation parameters include an assessment of the company’s business model and product offerings, analysis of historical financial statements, financial and valuation ratios, and recent business developments over the last 4 to 12 quarters.
4th June, 2026
This is an equity-only, large-cap model portfolio comprising stocks selected exclusively from the Nifty 50 and Nifty Next 50 indices.
The model portfolio is rebalanced quarterly, following the conclusion of each earnings season. Rebalancing occurs four times in a financial year, as outlined:
Q1 (April–June)
Rebalanced by end-August, post earnings season (July to mid-August)
Q2 (July–September)
Rebalanced by end-November, post earnings season (October to mid-November)
Q3 (October–December)
Rebalanced by end-February, post earnings season (January to mid-February)
Q4 (January–March)
Rebalanced by end-May, post earnings season (April to end-May)
Rebalancing dates are aligned with the earnings disclosure timelines of listed companies to reflect the most recent financial and business developments.
The model portfolio consists of 5 stocks; each assigned an equal weight of 20%.
1 year
The model portfolio is updated at predefined quarterly intervals, aligned with the conclusion of each corporate earnings season.
Investments in equity securities are subject to market risks, including price volatility, economic and political uncertainties, interest rate fluctuations, and sector-specific developments. Past performance is not indicative of future results. There is no assurance of returns or capital protection. Investors are advised to consider their risk tolerance and investment objectives before acting on this model portfolio.
The performance of this model portfolio will be benchmarked against the Nifty 100 index.
Date: 4th June, 2026
01 • Stock 1 of 5

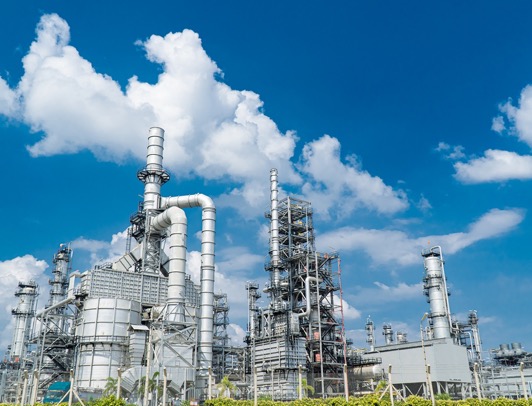
Reliance Industries Limited (RIL), incorporated in 1973 and headquartered in Mumbai, is one of India’s largest and most diversified conglomerates. RIL began as a textiles manufacturer and has since evolved into an integrated business group with significant presence across the oil-to-chemicals (O2C) value chain, including upstream exploration, refining, and petrochemicals.
The company also operates India’s largest organized retail network under Reliance Retail and leads the digital connectivity space through its telecom arm, Reliance Jio.
In recent years, RIL has expanded into the renewable energy and circular economy space, with ongoing investments in solar, hydrogen, battery storage, and advanced materials manufacturing. The company has also built a presence in India’s media and entertainment sector through Network18 and Jio Studios, and its recent merger of Jio Hotstar.
Reliance Industries Limited (RIL) operates a diversified, vertically integrated portfolio across six core business segments—Energy, Petrochemicals, Retail, Digital Services, New Energy & New Materials, and Media & Entertainment.
Oil and Gas Exploration & Production (E&P):
The company’s deep-water operations in the Krishna-Godavari (KG) D6 Block represent India’s first ultra-deep-water fields. Developed in partnership with BP, the R Cluster, Satellite Cluster, and MJ fields together contribute ~30% of India’s domestic gas production, operating at depths exceeding 2,000 meters—making R Cluster the deepest offshore producing field in Asia. Production from these assets supports national energy security and reduces import dependence, having already displaced over $40 billion in energy imports. In the unconventional energy space, RIL’s coal bed methane (CBM) operations in Madhya Pradesh represent the country’s largest surface footprint in hydrocarbon E&P. Over 300 wells are currently producing, connected to India’s gas grid through a 302-km dedicated pipeline.
Refining and Marketing (R&M):
The Jamnagar Refinery Complex—RIL’s flagship downstream asset—is the world’s largest and most complex single-site refinery, with a nameplate capacity of 1.4 million barrels per day and a complexity index of 21.1. This unique configuration allows RIL to process over 216 types of crude oil, ensuring maximum flexibility across geographies and price cycles. The refinery houses the world’s largest petcoke gasification plant and the world’s largest Refinery Off-Gas Cracker (ROGC), enabling near-total conversion of the bottom barrel and enhanced integration with petrochemicals.
Jamnagar is supported by a robust logistics ecosystem, including marine facilities capable of handling Very Large Crude Carriers (VLCCs). This infrastructure enables RIL to switch seamlessly between export and domestic markets based on demand-supply dynamics and margin optimization. The refining product slate includes LPG, gasoline, naphtha, ATF, diesel, and petrochemical feedstocks.
Downstream integration is furthered through Reliance BP Mobility Ltd (RBML), a joint venture with bp operating under the Jio-bp brand. RBML’s network of over 1,700 outlets delivers fuels, EV charging, and convenience services.
RIL’s petrochemicals division is among the most integrated and diversified globally, serving as a cornerstone of its Oil-to-Chemicals (O2C) strategy. With facilities across Jamnagar, Hazira, Dahej, Nagothane, Vadodara, and multiple international locations, the segment encompasses polymers, polyesters, fibre intermediates, elastomers, aromatics, and composites. RIL is the world’s largest polyester producer and ranks among the top five producers globally of PTA, PP, and PX. The integrated O2C model enables seamless conversion from crude oil to high-margin chemical products, reducing feedstock volatility and boosting profitability. A Rs. 75,000 crore capacity expansion program is underway, including a 3 MMTPA PTA plant and a 1 MMTPA PET plant at Dahej, as well as world-scale PVC production in India and the UAE. Upon completion, RIL is expected to rank among the top five PVC producers globally. RIL is also pioneering sustainable practices through circular economy initiatives, including PET bottle recycling (targeting 5 billion bottles annually), chemical recycling, and the development of biodegradable plastics—enhancing both ESG credentials and long-term competitive positioning.
Reliance Retail is India’s largest and most profitable retail enterprise, with a footprint of over 19,340 stores spanning 77.4 million square feet and a registered customer base exceeding 349 million. The business spans core verticals such as grocery, fashion and lifestyle, consumer electronics, luxury, and pharmacy, supported by a robust omni-channel framework integrating physical retail with digital platforms like JioMart. Strategically, Reliance Retail has adopted a “scale with inclusion” model. Through its New Commerce initiative, the company partners with over a million small merchants and kiranas, digitally enabling them with supply chain access, product assortment, and tech support.
Reliance Jio, launched in 2016, has transformed India’s digital infrastructure. In less than a decade, it has built the largest telecom network in the country. With over 488 million subscribers (in FY25) and ~60% share of India’s total data traffic (in FY24), JPL’s network handles 184.5 billion GB of data annually. Jio also offers wireless, fiber-to-home, enterprise solutions, and digital applications, supported by AI, blockchain, AR/VR, IoT, and edge computing. The company’s strategic partnerships with Meta, Google, and Microsoft have further expanded its ecosystem, delivering solutions such as JioPhone Next, WhatsApp commerce integration, and cloud-native 5G. The platform is expanding into digital verticals like healthcare, education, media, and smart cities—creating long-term monetization avenues.
RIL is making a bold pivot to green energy, with a stated ambition to become net-zero by 2035. Central to this transition is the Dhirubhai Ambani Green Energy Giga Complex in Jamnagar, a 5,000-acre facility that will host five giga factories for: solar PV, battery storage, green hydrogen, fuel cells, and power electronics.
The company is investing Rs. 75,000 Crores across the green value chain, including quartz-to-module solar manufacturing, sodium-ion and LFP battery technologies, modular electrolyser systems, and EV-ready fuel cell systems. RIL is also constructing one of the world’s largest carbon fibre facilities (20,000 MTPA), critical for wind turbine blade manufacturing, and has entered into several global partnerships—Faradion, REC Solar, NexWafe, and Caelux—to secure intellectual property and supply chain leadership.
In bio-energy, RIL aims to set up 100 compressed biogas plants over five years and become India’s largest producer of biofuels. These initiatives address India’s energy trilemma—affordability, sustainability, and security—and represent a multi-decade opportunity to transform from a fossil fuel importer to a renewable energy exporter.
Reliance Industries operates a diversified media and entertainment portfolio through JioStar, Network18, and Jio Studios, spanning broadcast, digital news, OTT platforms, and film production. The group’s properties reach 227 million monthly digital news readers and 225 million monthly JioCinema viewers, supported by a “Digital First, TV Always” strategy emphasizing vernacular content, cross-platform integration, and technology-led scalability. In FY2024, Jio Studios reported box office revenues of Rs. 700 Crores, producing content that garnered over 80 awards across categories. JioStar reported revenues of Rs. 10,006 Crores since the merger. JioHotstar recorded 503 million monthly active users (MAUs) in March 2025, driven by marquee sporting events such as the ICC Champions Trophy and the Indian Premier League (IPL), alongside access to India's largest digital content library exceeding 320,000 hours.
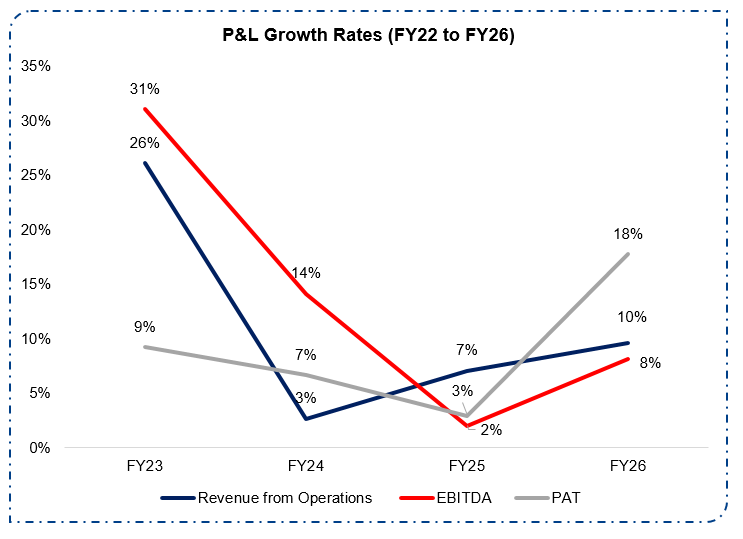
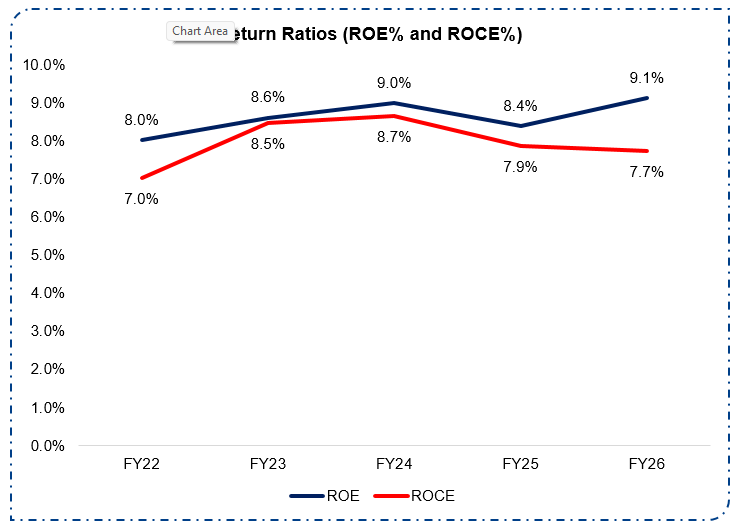
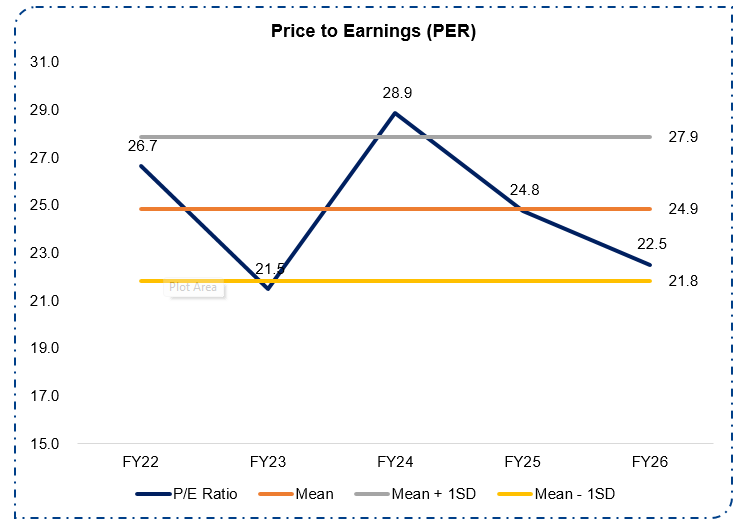
| Ratios | FY22 | FY23 | FY24 | FY25 | FY26 |
|---|---|---|---|---|---|
| EPS | 44.9 | 49.3 | 51.5 | 51.5 | 59.7 |
| P/E | 26.7 | 21.5 | 28.9 | 24.8 | 22.5 |
| P/BV | 1.8 | 1.7 | 2.2 | 1.7 | 2.0 |
| Du Pont Analysis | |||||
| (a) Net Profit / Sales | 0.10 | 0.08 | 0.09 | 0.08 | 0.09 |
| (b) Sales / Total Assets | 0.49 | 0.57 | 0.54 | 0.52 | 0.51 |
| (c) Total Assets / Total Equity | 1.67 | 1.81 | 1.92 | 2.00 | 1.97 |
| Return on Equity | 8.0% | 8.6% | 9.0% | 8.8% | 9.1% |
| Return on Capital Employed | 7.0% | 8.5% | 8.7% | 8.3% | 7.7% |
*PER for FY26 is calculated as of 31st March with FY26 Profit
| Particulars | FY24 | FY25 | FY26 |
|---|---|---|---|
| Revenue from Operations | 9,01,064 | 9,64,693 | 10,57,219 |
| Other Income | 16,057 | 17,978 | 28,962 |
| Total Income | 9,17,121 | 9,82,671 | 10,86,181 |
| Less: Expenses | 7,38,831 | 7,99,249 | 8,78,270 |
| EBITDA | 1,62,233 | 1,65,444 | 1,78,949 |
| EBITDA Margin (%) | 18.0% | 17.1% | 16.9% |
| Less: Depreciation | 50,832 | 53,136 | 57,688 |
| EBIT | 1,11,401 | 1,12,308 | 1,21,261 |
| Less: Finance Cost | 23,118 | 24,269 | 27,061 |
| PBT and Associates & JV | 1,04,340 | 1,06,017 | 1,23,162 |
| Share of Profit / (Loss) of Associates and Joint Ventures | 387 | 522 | 144 |
| Exceptional Item (Net of Tax) | - | - | - |
| PBT | 1,04,727 | 1,06,539 | 1,23,306 |
| Less: Tax | 25,707 | 25,230 | 27,552 |
| PAT from Continuing Operations | 79,020 | 81,309 | 95,754 |
| Profit from Discontinued Ops (Net of Tax) | - | - | - |
| PAT | 79,020 | 81,309 | 95,754 |
| Earnings Per Share (EPS) (Rs.) | 51.5 | 51.5 | 59.7 |
| Particulars | FY24 | FY25 | FY26 |
|---|---|---|---|
| Equity and Liabilities | |||
| Equity Capital | 6,766 | 13,532 | 13,532 |
| Non-Controlling Interest | 1,32,307 | 1,66,426 | 1,81,836 |
| Reserves | 7,86,715 | 8,29,668 | 8,90,498 |
| Borrowings | 4,07,411 | 4,37,627 | 5,00,493 |
| Other Liabilities | 4,22,787 | 5,02,868 | 5,91,781 |
| Total Equity and Liabilities | 17,55,986 | 19,50,121 | 21,78,140 |
| Assets | |||
| Fixed Assets | 7,79,985 | 9,99,393 | 11,24,795 |
| CWIP | 3,38,855 | 2,62,358 | 2,37,686 |
| Investments | 2,25,672 | 2,42,381 | 2,48,332 |
| Cash and Cash Equivalents | 97,225 | 1,06,502 | 1,45,977 |
| Other Assets | 3,14,249 | 3,39,487 | 4,21,350 |
| Total Assets | 17,55,986 | 19,50,121 | 21,78,140 |
Source: CSEC Research, Company Filings, Company Website, NSE, BSE • Date: 4th June, 2026
02 • Stock 2 of 5
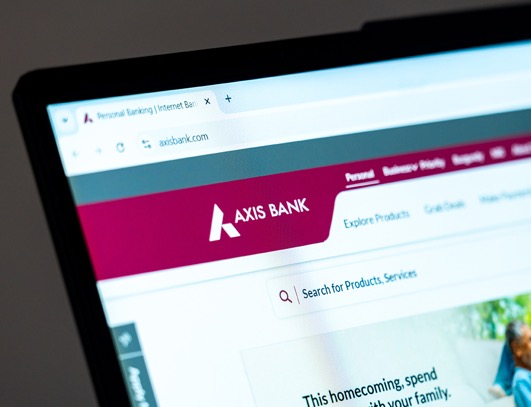
Axis Bank is India’s 3rd largest private bank, headquartered in Mumbai. Founded in 1993, the bank has a market capitalization of Rs. 3.61 lakh crores as of April 30, 2026. The consolidated entity provides a diverse range of financial services, including retail banking, wholesale and commercial banking, investment banking, asset management, insurance, MSME digital invoice discounting platform, and trustee services.
Axis Bank has a well-distributed and strategically established network of 6,275 branches. This includes 31% (1,945) in metro areas, 28% (1,757) in semi-urban areas, 22% (1,381) in urban areas, and 19% (1,192) in rural areas.
The company also has an international presence through branches in DIFC (Dubai) and Singapore, as well as representative offices in Abu Dhabi, Sharjah, Dhaka, and Dubai, and an offshore banking unit in GIFT City. Axis Bank serves approximately 5.9 crore customers and employs over 1,01,300 individuals.
The retail business segment provides a complete bouquet of products across deposits, transaction services, wealth management and lending products for retail customers, small businesses, NRIs (non-resident Indians) and retail institutions, backed by innovative, digital-first solutions.
The Bank’s Wholesale Coverage Group provides entire bouquet of products and services including cash credit facilities, demand and short-term loans, project finance, export credit, trade, forex and derivative solutions, payments and cash management systems, tax payments, salary accounts and trust services, commercial and credit cards etc. with the support of a well-defined Wholesale Banking Products team.
| Particulars | FY22 | FY23 | FY24 | FY25 | FY26 |
|---|---|---|---|---|---|
| EPS | 45.99 | 35.16 | 85.49 | 90.58 | 85.04 |
| EPS Growth | -23.5% | 143.1% | 6.0% | -6.1% | |
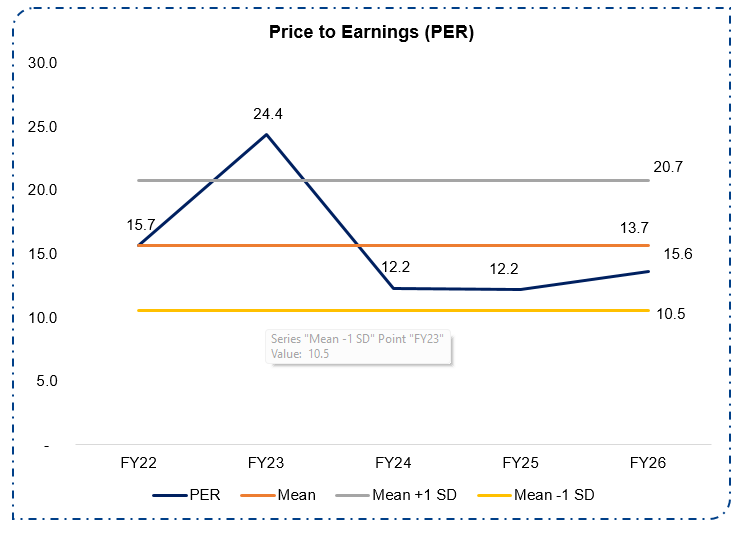
| PER | 15.68 | 24.42 | 12.25 | 12.17 | 13.66 |
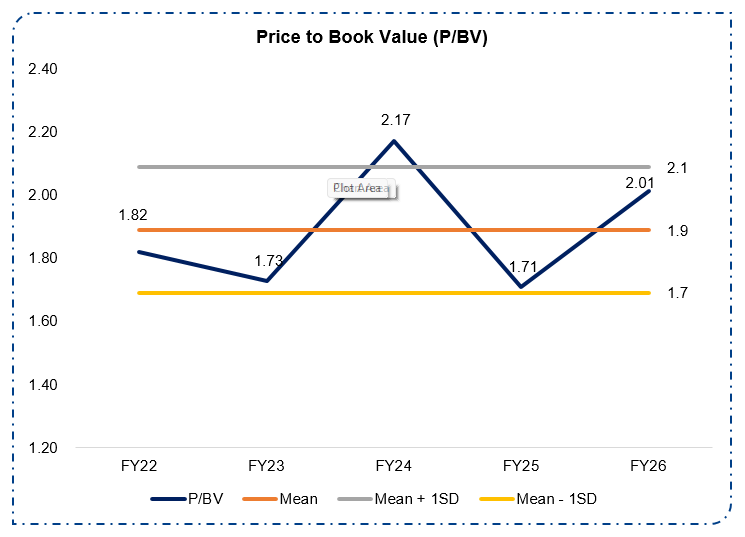
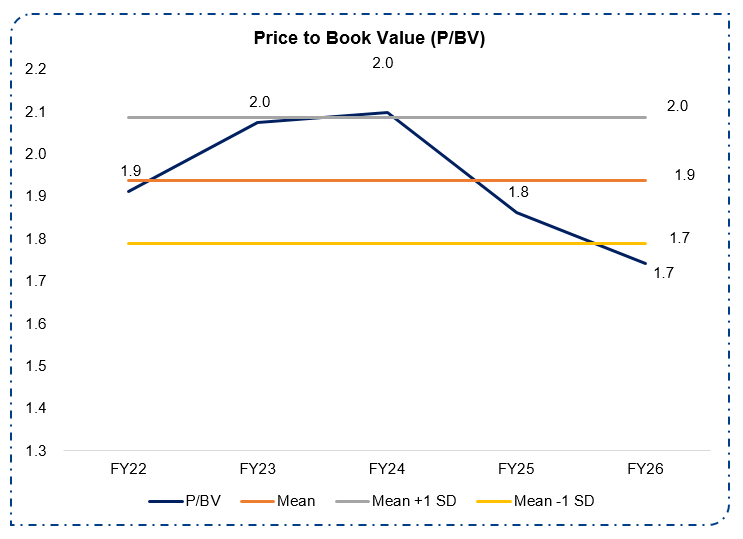
| P/BV | 1.86 | 2.02 | 2.05 | 1.81 | 1.69 |
| Particulars | FY22 | FY23 | FY24 | FY25 | FY26 |
| GNPA | 2.82% | 2.02% | 1.43% | 1.28% | 1.23% |
| NNPA | 0.73% | 0.39% | 0.31% | 0.33% | 0.37% |
| PCR | 75% | 81% | 79% | 75% | 70% |
| ROA | 1.21% | 1.82% | 1.83% | 1.88% | 2% |
| ROE | 12.91% | 18.38% | 18.86% | 17.11% | 14.74% |
| NIM | 3.47% | 4.02% | 4.07% | 3.98% | 3.62% |
*PER for FY26 is calculated as of 31st March with FY26 Profit
| Particulars | FY24 | FY25 | FY26 |
|---|---|---|---|
| Interest earned | 1,12,759 | 1,27,374 | 1,32,538 |
| a. Interest / discount on advances / bills | 90,314 | 1,01,582 | 1,04,658 |
| b. Income from investment | 20,082 | 23,057 | 25,444 |
| c. Interest on balances with RBI & others | 924 | 1,243 | 1,274 |
| d. Others | 1,439 | 1,492 | 1,163 |
| Other Income | 25,230 | 28,543 | 29,674 |
| Total Income | 1,37,989 | 1,55,917 | 1,62,212 |
| Interest expended | 61,391 | 71,036 | 74,075 |
| Operating Expenses | 37,243 | 39,992 | 42,226 |
| Employees Cost | 12,194 | 13,661 | 14,006 |
| Other Operating Expenses | 25,049 | 26,331 | 28,220 |
| Total Expenditure | 98,633 | 1,11,028 | 1,16,301 |
| Operating Profit | 39,356 | 44,889 | 45,911 |
| Provision (other than tax) & Contingencies | 4,178 | 8,166 | 13,617 |
| Exceptional Items | - | - | - |
| Profit from Ordinary Activities before tax | 35,178 | 36,722 | 32,293 |
| Tax Expenses | 8,754 | 8,610 | 5,800 |
| Net Profit for the Period | 26,424 | 28,112 | 26,494 |
| Earnings Per Share (EPS) (Rs.) | 85.49 | 90.58 | 85.04 |
| Particulars | FY24 | FY25 | FY26 |
|---|---|---|---|
| Capital & Liabilities | |||
| Capital | 617 | 619 | 622 |
| Employees' Stock Options Outstanding | 894 | 1,183 | 1,456 |
| Reserves & Surplus | 1,55,512 | 1,85,433 | 2,12,957 |
| Minority Interest | 499 | 635 | 798 |
| Deposits | 10,67,102 | 11,70,921 | 13,33,791 |
| Borrowing | 2,28,200 | 2,20,687 | 2,80,511 |
| Other Liabilities & Provision | 65,414 | 77,484 | 1,15,915 |
| Total Capital & Liabilities | 15,18,239 | 16,56,963 | 19,46,050 |
| Assets | |||
| Cash and Balances with Reserve Bank of India | 86,077 | 73,638 | 78,627 |
| Balances with Banks and Money at Call and Short Notice | 30,416 | 29,060 | 30,724 |
| Investments | 3,32,354 | 3,96,685 | 4,46,422 |
| Advances | 9,99,333 | 10,81,229 | 12,82,392 |
| Fixed Assets | 5,838 | 6,492 | 6,756 |
| Other Assets | 63,931 | 69,568 | 1,00,839 |
| Goodwill on Consolidation | 289 | 289 | 289 |
| Total Assets | 15,18,239 | 16,56,963 | 19,46,050 |
Source: CSEC Research, Company Filings, Company Website, NSE, BSE • Date: 4th June, 2026
03 • Stock 3 of 5
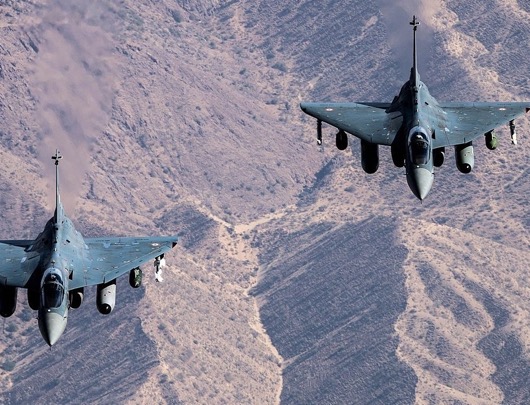
Hindustan Aeronautics Limited (HAL), incorporated in 1964 and headquartered in Bengaluru, is a Central Public Sector Enterprise (CPSE) under the administrative control of the Ministry of Defence, Government of India. HAL became a Maharatna company in October 2024, it plays a strategic role in India’s aerospace and defence ecosystem, serving as the country’s principal manufacturer of aircraft, helicopters, aero engines, avionics, and related systems.
With over seven decades of experience in aviation manufacturing, HAL has developed end-to-end capabilities across the aerospace value chain—from design and development to production, maintenance, repair, overhaul (MRO), and product support. The company operates 20 production and overhaul divisions and 9 co-located R&D centres, supporting a wide range of Indian Air Force, Army, Navy, Coast Guard, and civil aviation programs.
HAL’s product portfolio includes the Light Combat Aircraft (LCA) Tejas, Su-30MKI, HTT-40 basic trainer, Hawk advanced jet trainers, and the Dornier Do-228 utility aircraft. Its rotary-wing programs include the Dhruv Advanced Light Helicopter, Light Combat Helicopter (LCH), and Light Utility Helicopter (LUH). HAL is also engaged in joint development programs and exports platforms and aerospace components globally.
As of March 2026, HAL maintained a strong order book of Rs. 2,54,538 Crores, with a significant pipeline of new contracts in negotiation.
HAL designs, manufactures, and supports a range of military and civil aircrafts. Its fixed-wing portfolio includes the Light Combat Aircraft (LCA) Tejas, Intermediate Jet Trainer (IJT), Hindustan Turbo Trainer-40 (HTT-40), Su-30 MKI, Hawk Advanced Jet Trainers (AJT), and Dornier Do-228 utility aircraft. The LCA Mk1A is among the largest indigenization efforts in Indian aerospace, with projected indigenous content exceeding 65% in future production batches. HAL has also set up a third manufacturing line for the LCA in Nashik to meet long-term demand. The Dornier Do-228, developed under license from Germany’s Dornier GmbH, is now manufactured solely by HAL and caters to both defence and civil markets. It is deployed for maritime surveillance, training, commuter services, and logistical support. HAL maintains worldwide marketing and support rights for this platform and offers end-to-end MRO services for its airframe, engines, and avionics.
HAL has developed extensive in-house expertise in rotary-wing platforms, including light utility and combat helicopters. Its flagship offering is the Dhruv Advanced Light Helicopter (ALH), a 5.5-tonne class, twin-engine, multi-role platform developed indigenously. The Dhruv is deployed in both utility and armed variants (Rudra) and is in service across the Indian Army, Navy, and Air Force. Production capacities have been augmented with the commissioning of a new greenfield helicopter manufacturing facility at Tumakuru, Karnataka, entirely funded through internal accruals. The other rotary-wing offerings include:
HAL contributes components and sub-systems for India’s space programs, including nose cones, tank shrouds, and heat shield assemblies for launch vehicles. It also supports the civilian aviation segment via airframe and engine support for commuter aircraft like the Dornier Do-228.
HAL manufactures, repairs, and overhauls a wide variety of aero engines under license from Rolls-Royce, Turbomeca, Honeywell, and others. Engine programs include:
Additionally, HAL services marine gas turbines (e.g., LM2500 series) used in naval ships and offshore oil platforms, extending its relevance beyond aerospace. The company recently signed an MoU with GE for licensed manufacturing of the GE 414 engine for the LCA Mk2, with a targeted indigenization level of 80%. HAL’s engine divisions also specialize in development of small gas turbines and test beds for various platforms.
HAL provides MRO services across the life cycle of over 17 types of aircraft and helicopters, including platforms not manufactured by the company. MRO constitutes a critical revenue stream with relatively higher margins and recurring cash flow. Key services include:
HAL has also entered into a working partnership with Airbus for future MRO services, positioning itself as a regional hub for both domestic and export markets.
HAL offers spare part manufacturing, refurbishment, and export support to international customers in Southeast Asia, Africa, and the Middle East. Its clientele spans military and civil operators across countries such as Malaysia, Thailand, Vietnam, Sri Lanka, and the UAE.
HAL designs and maintains a wide range of avionics systems, both indigenously developed and licensed. These include:
The company is progressively working on integrating indigenous systems like the Uttam AESA radar into the LCA Mk1A platform, enhancing self-reliance in critical avionics sub-systems.
HAL supplies complex aerostructures and components for both domestic and international aerospace programs. Key deliverables include:
Its manufacturing capabilities encompass sheet metal, precision machining, composite fabrication, and advanced 3D modeling and digital design support for global OEMs.
HAL’s software division provides advanced digital engineering capabilities including 3D modeling, structural design, wind tunnel testing, and finite element analysis. The division supports internal programs and global OEMs with digitization and engineering consultancy, leveraging platforms such as CATIA, Unigraphics, NASTRAN, and Teamcenter.
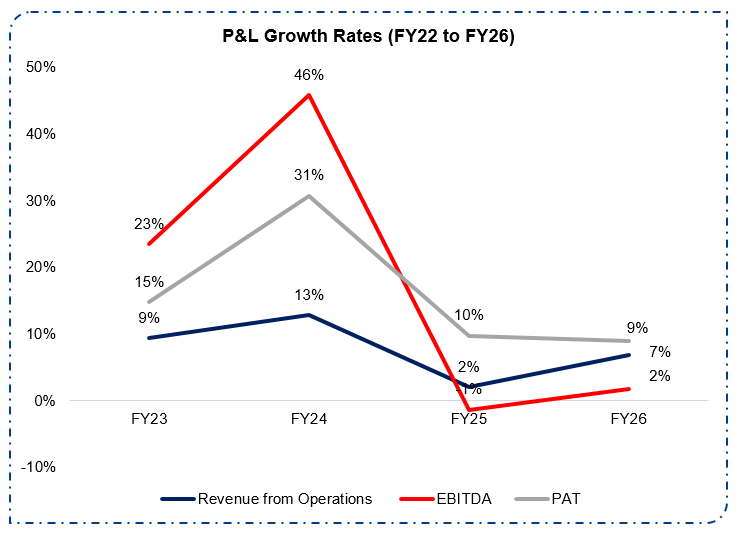
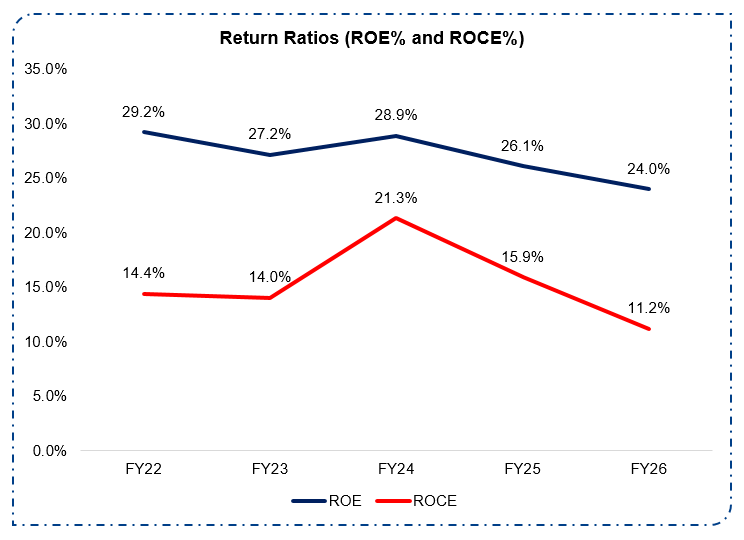
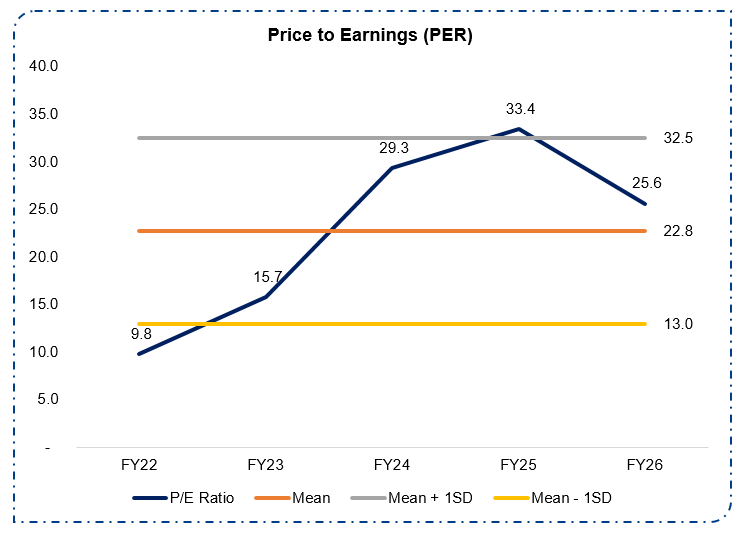
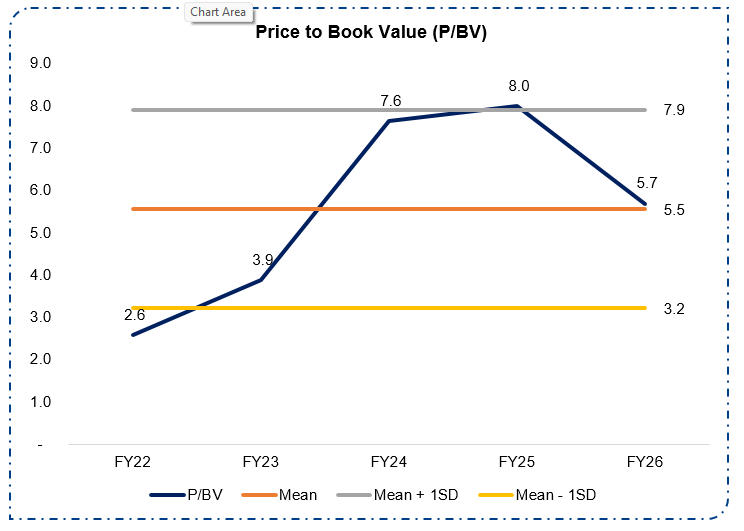
| Ratios | FY22 | FY23 | FY24 | FY25 | FY26 |
|---|---|---|---|---|---|
| EPS | 76.1 | 86.9 | 113.6 | 125.1 | 136.3 |
| P/E | 9.8 | 15.7 | 29.2 | 33.4 | 25.6 |
| P/BV | 2.6 | 3.9 | 7.6 | 8.0 | 5.7 |
| Du Pont Analysis | |||||
| (a) Net Profit / Sales | 0.21 | 0.22 | 0.25 | 0.27 | 0.28 |
| (b) Sales / Total Assets | 0.45 | 0.43 | 0.42 | 0.34 | 0.28 |
| (c) Total Assets / Total Equity | 3.17 | 2.93 | 2.76 | 2.87 | 3.14 |
| Return on Equity | 29.2% | 27.2% | 28.9% | 26.1% | 24.0% |
| Return on Capital Employed | 14.4% | 14.0% | 21.3% | 15.9% | 11.2% |
*PER for FY26 is calculated as of 31st March with FY26 Profit
| Particulars | FY24 | FY25 | FY26 |
|---|---|---|---|
| Revenue from Operations | 30,381 | 30,981 | 33,089 |
| Other Income | 1,897 | 2,562 | 3,699 |
| Total Income | 32,278 | 33,543 | 36,788 |
| Less: Expenses | 20,640 | 21,373 | 23,319 |
| EBITDA | 9,741 | 9,608 | 9,770 |
| EBITDA Margin (%) | 32.1% | 31.0% | 29.5% |
| Less: Depreciation | 1,407 | 1,340 | 1,355 |
| EBIT | 8,334 | 8,268 | 8,415 |
| Less: Finance Cost | 32 | 9 | 6 |
| EBT | 10,198 | 10,821 | 12,108 |
| Share of Profit / (Loss) of Associates and Joint Ventures | 27 | 41 | 44 |
| PBT | 10,225 | 10,867 | 12,152 |
| Less: Tax | 2,604 | 2,503 | 3,036 |
| PAT | 7,621 | 8,364 | 9,115 |
| Earnings Per Share (EPS) (Rs.) | 113.6 | 125.1 | 136.3 |
| Particulars | FY24 | FY25 | FY26 |
|---|---|---|---|
| Equity and Liabilities | |||
| Equity Capital | 334 | 334 | 334 |
| Non-Controlling Interest | 4 | 4 | 3 |
| Reserves | 28,804 | 34,647 | 40,707 |
| Borrowings | 2,958 | 3,327 | 3,235 |
| Other Liabilities | 45,995 | 67,955 | 88,135 |
| Total Equity and Liabilities | 78,095 | 1,06,267 | 1,32,415 |
| Assets | |||
| Fixed Assets | 6,737 | 6,671 | 7,293 |
| CWIP | 2,493 | 3,098 | 3,313 |
| Investments | 1,390 | 1,509 | 1,626 |
| Cash and Cash Equivalents | 26,432 | 38,182 | 46,197 |
| Other Assets | 41,044 | 56,807 | 73,985 |
| Total Assets | 78,095 | 1,06,267 | 1,32,415 |
Source: CSEC Research, Company Filings, Company Website, NSE, BSE • Date: 4th June, 2026
04 • Stock 4 of 5
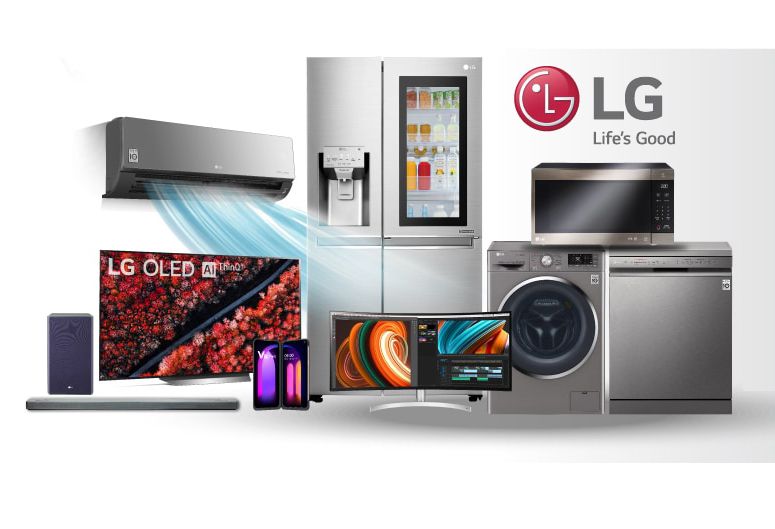
LG Electronics India Private Limited, a wholly owned subsidiary of LG Electronics, was incorporated in 1997 and has since established itself as a market leader in the Indian home appliances and consumer electronics sector (excluding mobile phones). Backed by the global strength and innovation of LG Electronics—recognized as the leading single-brand global home appliances player by revenue in CY2024 according to the Redseer Report—the company has consistently maintained its position as the number one player in India across multiple product categories. For the six-month period ended June 30, 2025, and calendar years 2024, 2023, and 2022, LG Electronics India led the market in terms of value share in the offline channel, which represents approximately 78% and 77% of the major home appliances and consumer electronics market in India during the respective periods. The company’s dominance spans key categories including washing machines, refrigerators, panel televisions, inverter air conditioners, and microwaves.
With a deep understanding of Indian consumer preferences developed over 28 years of local operations, LG Electronics India has leveraged its parent company’s pioneering technology to introduce innovative and tailored products. Notably, it was among the first to introduce inverter air conditioners in India in 2014 and became the only player to fully transition to inverter technology by 2017. As of December 31, 2024, and June 30, 2025, approximately 80% of air conditioners sold in India were inverter-based, reflecting the company’s leadership in driving technological adoption. In addition to product innovation, LG Electronics India was the first among leading players to replace plastic tanks with stainless steel tanks in water purifiers in 2013, further demonstrating its commitment to quality and consumer well-being.
The company offers one of the widest product portfolios in the industry and serves both B2C and B2B customers across India and international markets. Its comprehensive service offerings include product installation, repair, and maintenance. Operating across two business segments, LG Electronics India continues to build on its legacy of trust, innovation, and excellence, supported by the globally recognized LG brand, which was listed on Interbrand’s Top 100 Best Global Brands in 2024.
Distribution and Service Network: LG Electronics India Private Limited operates the largest distribution network among leading home appliances and consumer electronics companies in India, with 35,640 B2C touchpoints and 463 B2B trade partners as of June 30, 2025, according to the Redseer Report. Its reach spans urban and rural regions, supported by 286 customer service employees and a strong presence across all major distribution formats. The company promotes its products through targeted campaigns and on-ground sales promoters who engage directly with consumers. Nearly half of LG’s trade partners have been associated with the brand for over a decade, reflecting deep-rooted channel relationships. Complementing its distribution strength, LG also runs one of the largest after-sales service networks in India, with 1,006 service centers, 13,368 engineers, and four call centers. This infrastructure enables same-day installations and efficient maintenance services, reinforcing LG’s commitment to customer satisfaction and helping sustain its market leadership.
Global Parentage and Management: LG Electronics India Private Limited benefits significantly from its global parent, LG Electronics, which was recognized as the leading single-brand global home appliances company by market share in revenue for CY2024. The parent company’s commitment to delivering high-quality products and exceptional consumer experiences underpins LG India’s operations, providing strategic advantages in technology innovation, product development, manufacturing excellence, quality control, and brand marketing. The company’s operations in India are guided by a seasoned and stable leadership team. As of June 30, 2025, Chief Sales Officer Sanjay Chitkara has been with the organization for over 26 years; Chief Operating Officer Ashish Agrawal for over 25 years; Chief Accounting Officer Atul Khanna for over 21 years; and Chief Manufacturing Officer Gagan Jeet Singh brings over 27 years of experience within LG and the broader industry. This leadership team exemplifies the company’s blend of global corporate governance standards and deep local market expertise. LG Electronics India is committed to operating with fairness, transparency, and integrity.
In-House Manufacturing Capacity: The company operates one of the largest in-house production capacities among leading home appliances and consumer electronics players in India (excluding mobile phones), as of June 30, 2025. Its two manufacturing units in Noida and Pune collectively accounted for over 85% of overall sales across multiple periods, including the three months ended June 30, 2025 and 2024, and Fiscals 2025, 2024, and 2023.
Flexible and Automated Production: The Noida and Pune facilities are designed for flexibility and scalability, using advanced automation technologies to produce a wide range of products—including refrigerators, water purifiers, air conditioners, televisions, monitors, and digital signages—on shared production lines. As of June 30, 2025, 77 auto-guided vehicles supported unmanned logistics and part feeding operations. Additional automation initiatives include smart monitoring systems, robotic systems, and automated material handling equipment.
Enhanced Productivity and Utilization: In Fiscal 2025, LG achieved a capacity utilization rate of at least 82.72% for its air conditioner, washing machine, and microwave oven lines. These improvements led to a 29% increase in productivity per hour for air conditioners and a 13% increase for washing machines between Fiscals 2022 and 2025.
Robust and Localized Supply Chain: LG’s supply chain includes 287 suppliers with an average relationship tenure of 13.13 years as of June 30, 2025. The company has adopted a phased localization strategy to support domestic industry and reduce import reliance, helping mitigate exchange rate risks and lower operational costs.
Growth in Domestic Sourcing: The share of raw materials sourced from domestic suppliers rose from 50.48% in Fiscal 2023 to 53.79% in Fiscal 2025, with quarterly figures reaching 58.29% and 54.12% for the three months ended June 30, 2024 and 2025, respectively.
Supplier Quality and Loyalty: LG maintains rigorous supplier onboarding standards, focusing on production quality, supply stability, technological capabilities, and sustainability. As of June 30, 2025, 65.51% of LG’s third-party raw material suppliers had been associated with the company for over 13 years, reflecting strong supplier loyalty and operational consistency.
The company operates under the Home Appliances and Air Solution segment, offering a diverse portfolio of products that includes refrigerators, washing machines, water purifiers, dishwashers, microwave ovens, air conditioners, air purifiers, and compressors. These products are supported by comprehensive installation and after-sales services, ensuring a seamless consumer experience.
Refrigerators: The company introduced its first refrigerator in 1997, beginning with a single door model. Over the years, the refrigerator portfolio has expanded to include French door, side-by-side, double door, and single door refrigerators, each available in multiple variants and designs. These refrigerators cater to a wide range of consumer preferences in terms of design and capacity, and are equipped with advanced features such as Door Cooling+ (which provides additional cooling vents on the doors), Convertible functionality (allowing the freezer to be converted into a fridge), and HygieneFresh+ (which includes anti-bacterial deodorization filters to maintain freshness and reduce odors). The refrigerators are typically certified by the Bureau of Indian Standards (BIS), Bureau of Energy Efficiency (BEE), and Wireless Planning & Coordination (WPC), and have received approvals from relevant Indian authorities. Refrigerators manufactured in India are exported to markets across the Middle East, Asia, Africa, and South America.
Washing Machines and Dryers: The company launched its first top load washing machine in 1997 and has since expanded its offerings to include wash towers (integrated washer-dryer units), standalone dryers, washer-dryers, front load and top load machines, and semi-automatic washing machines. These products serve both residential and commercial consumers. The washing machines incorporate innovative technologies such as 6 Motion Direct Drive (which simulates hand washing through varied drum movements), AI Direct Drive (which uses artificial intelligence to optimize washing patterns based on fabric type and load), LG ThinQ (enabling smart home integration via Wi-Fi), LG Steam (for bacterial elimination), Wrinkle Care (for crease-free laundry), Turbo Wash (for faster cleaning), and Toughened Glass exteriors (for enhanced durability). These machines are certified by BEE, BIS, and WPC, and are exported to regions including the Middle East and Africa.
Air Conditioners: The company entered the air conditioning market in 1998 and currently manufactures a wide range of residential and commercial air conditioning solutions. The residential segment includes split and window air conditioners, offered in various designs and configurations. For commercial and B2B clients, the company provides systems such as Multi V cassette, ductable units, Multi-I home systems, and chillers, which are suitable for large-scale applications in residential complexes, hotels, offices, educational institutions, airports, and shopping malls. The air conditioners feature advanced technologies including AI Convertibles (which adapt cooling based on usage patterns and environmental conditions), ThinQ Wi-Fi (for remote monitoring and control), and Plasmaster Ionizer (for air purification). New models also include an energy manager that allows users to monitor electricity usage and receive maintenance alerts via the ThinQ app. In 2016, the company transitioned its air conditioner portfolio to inverter technology to enhance energy efficiency. These products are certified by BEE, BIS, and WPC, and are primarily exported to Sri Lanka and Nepal.
Other Products: In addition to its core product lines, the company also offers water purifiers, dishwashers, microwave ovens, air purifiers, and compressors under the Home Appliances and Air Solution division. These products are available in multiple variants and are designed with technology-enabled features to enhance user comfort and convenience.
The company’s Home Entertainment division encompasses a wide array of media display and audiovisual products. It manufactures televisions, monitors, interactive displays, and information systems, while importing soundbars, audio systems, projectors, wireless speakers, and earbuds for sale in domestic markets. This segment is designed to cater to both residential and commercial consumers, offering technologically advanced and user-centric solutions.
Televisions: The company introduced its first television in 1997 and has since developed a diverse portfolio ranging from miniature to large-screen models. Its premium television offerings feature cutting-edge technologies such as OLED, QNED, NanoCell, UHD, and LED. To enhance consumer experience, the company has launched innovative formats including rollable televisions, wallpaper televisions, and gallery televisions. Additionally, lifestyle television screens are available for residential users, equipped with mobile integration and touch capabilities that adapt to various viewing environments. All television products are typically certified by the Bureau of Energy Efficiency (BEE), Bureau of Indian Standards (BIS), and Wireless Planning & Coordination (WPC).
Other Products: Beyond televisions, the Home Entertainment division offers a variety of home audio products, primarily comprising soundbars, wireless and party speakers, and wireless earbuds. For business-to-business (B2B) clients, the company supplies information technology systems such as monitors used in hospitals for surgical procedures, as well as in hotels, museums, airports, and gaming environments. It also provides commercial display solutions including televisions for hospitality settings, monitor signage for banks, airports, railway stations, and hotels, interactive display boards for educational institutions, shopping malls, and government offices, and LED screens for offices, indoor and outdoor signage, and home theatre systems.
| Particulars | FY24 | FY25 | FY26 |
|---|---|---|---|
| Revenue from Operations | 21,352 | 24,367 | 24,605 |
| Other Income | 205 | 264 | 328 |
| Total Income | 21,557 | 24,631 | 24,933 |
| Less: Expenses | 19,127 | 21,257 | 22,196 |
| EBITDA | 2,225 | 3,110 | 2,409 |
| EBITDA Margin (%) | 10.42% | 12.76% | 9.8% |
| Less: Depreciation | 364 | 380 | 396 |
| EBIT | 1,861 | 2,730 | 2,013 |
| Less: Finance Cost | 29 | 31 | 41 |
| PBT | 2,037 | 2,963 | 2,300 |
| Less: Tax | 526 | 760 | 614 |
| PAT | 1,511 | 2,203 | 1,685 |
| Earnings Per Share (EPS) (Rs.) | - | 32.46 | 24.83 |
| Particulars | FY24 | FY25 | FY26 |
|---|---|---|---|
| Equity and Liabilities | |||
| Equity Capital | 113 | 679 | 679 |
| Reserves | 3,659 | 5,291 | 6,987 |
| Non-Controlling Liabilities | 718 | 900 | 979 |
| Other Liabilities | 4,009 | 4,647 | 4,991 |
| Total Equity and Liabilities | 8,498 | 11,517 | 13,636 |
| Assets | |||
| Fixed Assets | 1,319 | 1,329 | 1,561 |
| CWIP | 24 | 75 | 457 |
| Cash and Cash Equivalents | 2,223 | 3,741 | 4,476 |
| Other Assets | 4,933 | 6,371 | 7,142 |
| Total Assets | 8,498 | 11,517 | 13,636 |
Source: CSEC Research, Company Filings, Company Website, NSE, BSE • Date: 4th June, 2026
05 • Stock 5 of 5

Mazagon Dock Shipbuilders Limited (MDL), established in 1774 and headquartered in Mumbai, is India’s oldest and most significant shipyard, playing a central role in the nation’s maritime and defence ecosystem. The company is engaged in the construction and repair of ships, submarines, vessels, and related engineering products, serving both domestic and international clients. It operates through two primary segments: Shipbuilding and Submarine & Heavy Engineering, reflecting its dual expertise in surface combatants, undersea platforms, and offshore engineering solutions.
MDL’s naval portfolio includes advanced platforms such as destroyers, conventional submarines, frigates, corvettes, missile boats, offshore patrol vessels, and floating border outposts, which form the backbone of the Indian Navy’s modernization program. Beyond defence, the company produces a wide range of merchant and commercial vessels, including general cargo ships, multipurpose support vessels, offshore supply vessels, tugs, dredgers, passenger-cum-cargo vessels, water tankers, barges, trawlers, and specialized structures such as windmill towers and pontoons.
The company also has a notable presence in the oil and gas sector, delivering offshore platforms and jack-up rigs, which highlight its engineering capabilities beyond defence. For the Indian Coast Guard, MDL supplies training ships, next-generation offshore patrol vessels, and fast patrol vessels, strengthening maritime security and coastal surveillance. In addition, MDL has expanded into advanced technology solutions, offering AI-enabled products such as remotely operated vehicles, phased array ultrasonic testing systems, and computerized radiography, underscoring its commitment to innovation and digital transformation in shipbuilding and engineering.
Formerly known as Mazagon Dock Limited, the company adopted its current name in May 2015 to reflect its broader shipbuilding identity. With centuries of legacy, advanced capabilities, and a diversified product portfolio, MDL continues to be a cornerstone of India’s defence indigenization under the “Make in India” and Atmanirbhar Bharat initiatives, while also expanding into commercial and technological domains to ensure sustained growth and long-term relevance.
Mazagon Dock Shipbuilders Limited (MDL) remains the backbone of the Indian Navy’s fleet, having built 31 warships and 8 submarines since 1960. Notable recent milestones include the commissioning of INS Nilgiri (frigate), INS Surat (destroyer), and INS Vagsheer (submarine) on January 15, 2025. MDL is the only Indian shipyard to have constructed both destroyers and conventional submarines for the Navy. It is currently the lead shipyard for the Project 17A Nilgiri-class stealth frigates and is preparing for major upcoming programs such as the Rs. 99,000 crore P-75I submarine project.
In addition to frontline combatants, MDL produces essential support vessels, including supply ships, multipurpose support vessels, water tankers, dredgers, and tugs. In 2024, the yard began production of a Multi-Purpose Vessel (MPV) for international clients, while continuing to deliver border outpost vessels for coastal security.
MDL is actively expanding its commercial presence to reduce reliance on domestic defence contracts. It has delivered cargo ships, passenger ferries, and fishing trawlers to both national and international customers. A significant strategic step was the acquisition of a 51% majority stake in Colombo Dockyard PLC in early 2026, positioning MDL as a regional leader in commercial shipbuilding and high-margin ship repair.
MDL remains a key partner for India’s oil and gas sector, recently securing major contracts from ONGC for wellhead platforms and pipeline replacement projects worth approximately Rs. 1,486 crore and Rs. 4,676 crore. The yard is also pioneering “Special Products,” including India’s first methanol dual-fuel platform supply vessel, signed in March 2026, and the ongoing development of unmanned vessels with AI-enabled dual navigation systems.
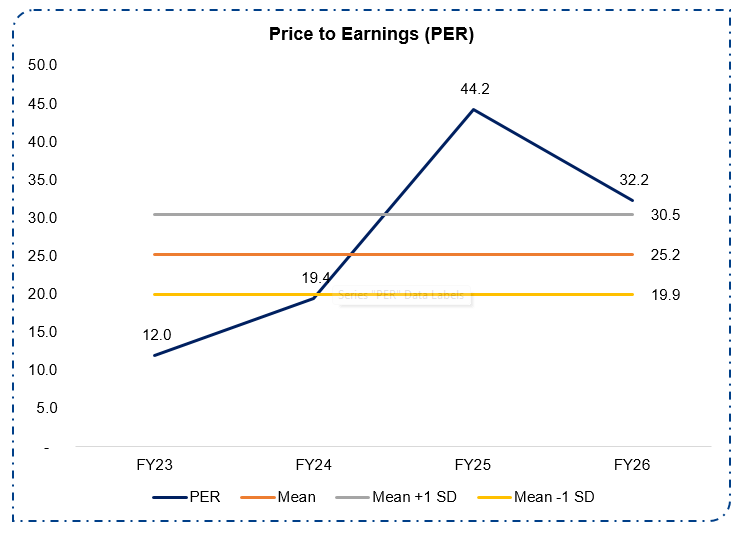
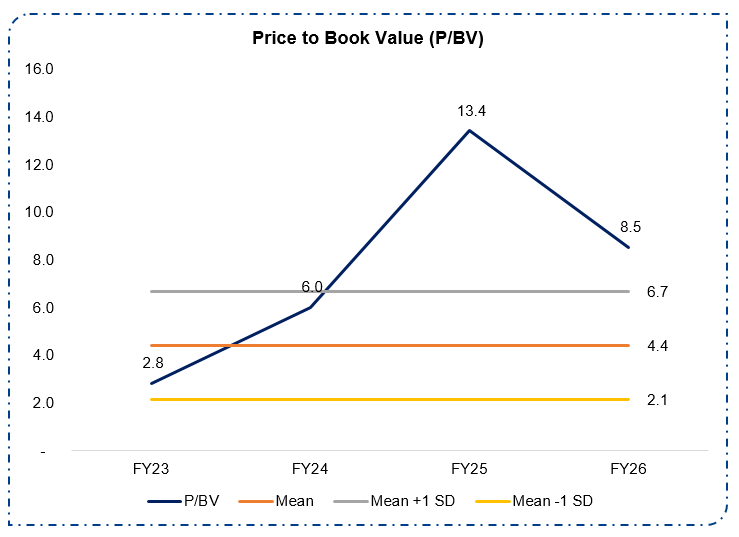
| Ratios | FY23 | FY24 | FY25 | FY26 |
|---|---|---|---|---|
| EPS | 27.74 | 48.02 | 59.83 | 64.04 |
| P/E | 11.95 | 19.41 | 44.19 | 32.25 |
| Book Value | 118.12 | 154.92 | 197.02 | 242.05 |
| P/BV | 2.81 | 6.02 | 13.42 | 8.53 |
| Du Pont Analysis | ||||
| (a) Net Profit / Sales | 0.14 | 0.20 | 0.21 | 0.20 |
| (b) Sales / Total Assets | 0.26 | 0.32 | 0.39 | 0.46 |
| (c) Total Assets / Total Equity | 6.87 | 5.35 | 4.10 | 3.17 |
| Return on Equity (abc) | 26.0% | 35.2% | 34.0% | 29.1% |
*PER for FY26 is calculated as of 31st March with FY26 Profit
| Particulars | FY24 | FY25 | FY26 |
|---|---|---|---|
| Revenue from Operations | 9,467 | 11,432 | 13,006 |
| Other Income | 1,101 | 1,121 | 1,139 |
| Total Income | 10,568 | 12,553 | 14,146 |
| Less: Expenses | 8,055 | 9,372 | 10,741 |
| EBITDA | 1,412 | 2,060 | 2,266 |
| EBITDA Margin (%) | 14.9% | 18.0% | 17.4% |
| Less: Depreciation | 83 | 115 | 97 |
| EBIT | 1,329 | 1,945 | 2,169 |
| Less: Finance Cost | 5 | 4 | 72 |
| EBT | 1,323 | 1,941 | 2,097 |
| Share of Profit / (Loss) of Associates and Joint Ventures | - | - | - |
| PBT | 2,425 | 3,062 | 3,237 |
| Less: Tax | 616 | 784 | 815 |
| PAT | 1,937 | 2,414 | 2,578 |
| Earnings Per Share (EPS) (Rs.) | 48.0 | 59.8 | 64.0 |
| Particulars | FY24 | FY25 | FY26 |
|---|---|---|---|
| Equity and Liabilities | |||
| Equity Capital | 202 | 202 | 202 |
| Reserves | 6,042 | 7,738 | 9,553 |
| Borrowings | 17 | 20 | 447 |
| Other Liabilities | 23,189 | 20,748 | 17,256 |
| Total Equity and Liabilities | 29,449 | 28,708 | 27,458 |
| Assets | |||
| Fixed Assets | 838 | 1,466 | 2,066 |
| CWIP | 72 | 133 | 249 |
| Investments | 679 | 765 | 915 |
| Cash and Cash Equivalents | 14,210 | 16,150 | 13,096 |
| Other Assets | 13,651 | 10,194 | 11,132 |
| Total Assets | 29,449 | 28,708 | 27,458 |
Source: CSEC Research, Company Filings, Company Website, NSE, BSE • Date: 4th June, 2026